


1. 들어가며
연초에 역사적 고점을 연이어 갱신한 이후로 미국장이 속절없이 무너지고 있다. 하루에도 지수가 3~4% 씩 빠지는 일이 비일비재 해지면서 멘탈을 잡기 쉽지 않은 요즘인데, 이쯤에서 이번 하락이 역사적으로 보았을 때 어느 정도의 하락인지 파악해볼 필요가 있을 것 같아 이 글을 쓰게 되었다. 특별한 분석이나 논리가 적용된 것은 아니니 가볍게 현황파악 용도로 보면 좋을 것 같다.
2. 현황파악
아래 기사들은 구글에 "S&P, 나스닥 하락"으로 검색했을 때 나오는 기사들이다. 물론 하락만 있었던 것은 아니고, 최근 한달 사이에 지수의 급격한 상승과 하락이 여러 번 반복되고 있다.
S&P500 지수를 추종하는 대표적 ETF인 SPY와 나스닥100 지수를 추종하는 대표적 ETF인 QQQ의 일별 종가 추이를 확인해보았다. 데이터는 야후 파이낸스에서 상장시점부터 6월 3일까지의 일별 종가를 가져왔고, 그래프는 plotly를 사용하여 그렸다.
import yfinance as yf
import plotly.express as px

df_SPY_yf = yf.Ticker('SPY').history('max', auto_adjust=True)
df_SPY_yf.index = df_SPY_yf.index.tz_localize('utc')

df_QQQ_yf = yf.Ticker('QQQ').history('max', auto_adjust=True)
df_QQQ_yf.index = df_QQQ_yf.index.tz_localize('utc')

fig = px.line(df_SPY_yf.reset_index(), x="Date", y="Close")
fig.update_layout(title='SPY Daily Close', title_x=0.5)

fig = px.line(df_QQQ_yf.reset_index(), x="Date", y="Close")
fig.update_layout(title='QQQ Daily Close', title_x=0.5)
그래프 우측 상단에 마우스 커서를 이동하면 몇 가지 기능들을 이용해볼 수 있고, 그래프의 특정 기간을 드래그 해서 선택하면 그 기간의 데이터만 줌인 해서 볼 수 있다. SPY와 QQQ 모두 2020년 3월의 코로나 폭락이후 미친듯이 상승하였는데, SPY는 대략 1년전, QQQ는 1년 반 전의 가격으로 되돌아간 것을 볼 수 있다. 기술주 위주의 나스닥100 지수를 추종하는 QQQ가 금융주나 에너지 관련주가 포함된 S&P500 지수를 추종하는 SPY보다 확실히 낙폭이 더 크다. 금리인상, 실적하락, 경기둔화 우려 등이 맞물려 기술주에 부여되었던 높은 벨류에이션이 사라지는 듯한 모습이다.
3. 역사적으로 보았을 때 지금의 하락이 어느 정도의 하락일까?
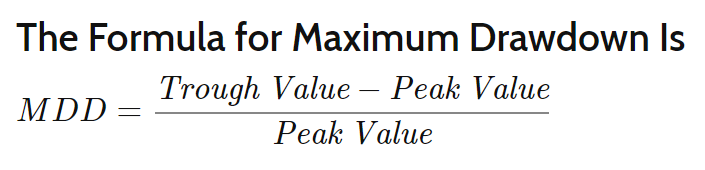
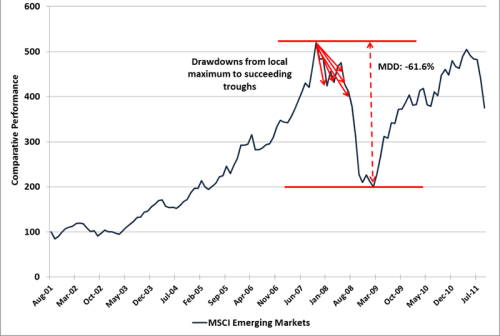
그렇다면 역사적으로 보았을 때 지금의 하락이 어느 정도인지 파악해볼 필요가 있다. 주가의 하락을 보통 'drawdown' 이라는 용어로 표현하는데, '특정 기간 동안의 최고점에서 최저점까지의 하락폭'이라고 정의할 수 있고, Maximum drawdown(MDD)는 drawdown의 전체 기간 중 최댓값이다.
퀀토피안에서 개발했고, 지금은 스테판 젠슨이 관리하는 pyfolio 패키지를 통해 drawdown 테이블을 만들 수 있다. pyfolio.show_worst_drawdown_periods 함수를 이용하면 drawdown table을 추출할 수 있다. 디폴트는 가장 하락이 컸던 5개의 drawdown periods를 뽑아주는 것인데, top 인자를 조절해서 하락이 큰 n개의 기간을 추출할 수 있다.
import empyrical as ep
import numpy as np

def get_max_drawdown_underwater(underwater):
    """
    Determines peak, valley, and recovery dates given an 'underwater'
    DataFrame.
    An underwater DataFrame is a DataFrame that has precomputed
    rolling drawdown.
    Parameters
    ----------
    underwater : pd.Series
       Underwater returns (rolling drawdown) of a strategy.
    Returns
    -------
    peak : datetime
        The maximum drawdown's peak.
    valley : datetime
        The maximum drawdown's valley.
    recovery : datetime
        The maximum drawdown's recovery.
    """

    valley = underwater.idxmin()  # end of the period
    # Find first 0
    peak = underwater[:valley][underwater[:valley] == 0].index[-1]
    # Find last 0
    try:
        recovery = underwater[valley:][underwater[valley:] == 0].index[0]
    except IndexError:
        recovery = np.nan  # drawdown not recovered
    return peak, valley, recovery


def get_top_drawdowns(returns, top=10):
    """
    Finds top drawdowns, sorted by drawdown amount.
    Parameters
    ----------
    returns : pd.Series
        Daily returns of the strategy, noncumulative.
         - See full explanation in tears.create_full_tear_sheet.
    top : int, optional
        The amount of top drawdowns to find (default 10).
    Returns
    -------
    drawdowns : list
        List of drawdown peaks, valleys, and recoveries. See get_max_drawdown.
    """

    returns = returns.copy()
    df_cum = ep.cum_returns(returns, 1.0)
    running_max = np.maximum.accumulate(df_cum)
    underwater = df_cum / running_max - 1

    drawdowns = []
    for _ in range(top):
        peak, valley, recovery = get_max_drawdown_underwater(underwater)
        # Slice out draw-down period
        if not pd.isnull(recovery):
            underwater.drop(
                underwater[peak:recovery].index[1:-1], inplace=True
            )
        else:
            # drawdown has not ended yet
            underwater = underwater.loc[:peak]

        drawdowns.append((peak, valley, recovery))
        if (
            (len(returns) == 0)
            or (len(underwater) == 0)
            or (np.min(underwater) == 0)
        ):
            break

    return drawdowns

def gen_drawdown_table(returns, top=10):
    """
    Places top drawdowns in a table.
    Parameters
    ----------
    returns : pd.Series
        Daily returns of the strategy, noncumulative.
         - See full explanation in tears.create_full_tear_sheet.
    top : int, optional
        The amount of top drawdowns to find (default 10).
    Returns
    -------
    df_drawdowns : pd.DataFrame
        Information about top drawdowns.
    """

    df_cum = ep.cum_returns(returns, 1.0)
    drawdown_periods = get_top_drawdowns(returns, top=top)
    df_drawdowns = pd.DataFrame(
        index=list(range(top)),
        columns=[
            "Net drawdown in %",
            "Peak date",
            "Valley date",
            "Recovery date",
            "Duration",
        ],
    )

    for i, (peak, valley, recovery) in enumerate(drawdown_periods):
        if pd.isnull(recovery):
            df_drawdowns.loc[i, "Duration"] = np.nan
        else:
            df_drawdowns.loc[i, "Duration"] = len(
                pd.date_range(peak, recovery, freq="B")
            )
        df_drawdowns.loc[i, "Peak date"] = peak.to_pydatetime().strftime(
            "%Y-%m-%d"
        )
        df_drawdowns.loc[i, "Valley date"] = valley.to_pydatetime().strftime(
            "%Y-%m-%d"
        )
        if isinstance(recovery, float):
            df_drawdowns.loc[i, "Recovery date"] = recovery
        else:
            df_drawdowns.loc[
                i, "Recovery date"
            ] = recovery.to_pydatetime().strftime("%Y-%m-%d")
        df_drawdowns.loc[i, "Net drawdown in %"] = (
            (df_cum.loc[peak] - df_cum.loc[valley]) / df_cum.loc[peak]
        ) * 100

    df_drawdowns["Peak date"] = pd.to_datetime(df_drawdowns["Peak date"])
    df_drawdowns["Valley date"] = pd.to_datetime(df_drawdowns["Valley date"])
    df_drawdowns["Recovery date"] = pd.to_datetime(
        df_drawdowns["Recovery date"]
    )

    return df_drawdowns

def show_worst_drawdown_periods(returns, top=5):
    """
    Prints information about the worst drawdown periods.
    Prints peak dates, valley dates, recovery dates, and net
    drawdowns.
    Parameters
    ----------
    returns : pd.Series
        Daily returns of the strategy, noncumulative.
         - See full explanation in tears.create_full_tear_sheet.
    top : int, optional
        Amount of top drawdowns periods to plot (default 5).
    """

    drawdown_df = gen_drawdown_table(returns, top=top)
    print_table(
        drawdown_df.sort_values("Net drawdown in %", ascending=False),
        name="Worst drawdown periods",
        float_format="{0:.2f}".format,
    )

from IPython.display import display, HTML
def print_table(
    table, name=None, float_format=None, formatters=None, header_rows=None
):
    """
    Pretty print a pandas DataFrame.
    Uses HTML output if running inside Jupyter Notebook, otherwise
    formatted text output.
    Parameters
    ----------
    table : pandas.Series or pandas.DataFrame
        Table to pretty-print.
    name : str, optional
        Table name to display in upper left corner.
    float_format : function, optional
        Formatter to use for displaying table elements, passed as the
        `float_format` arg to pd.Dataframe.to_html.
        E.g. `'{0:.2%}'.format` for displaying 100 as '100.00%'.
    formatters : list or dict, optional
        Formatters to use by column, passed as the `formatters` arg to
        pd.Dataframe.to_html.
    header_rows : dict, optional
        Extra rows to display at the top of the table.
    """

    if isinstance(table, pd.Series):
        table = pd.DataFrame(table)

    if name is not None:
        table.columns.name = name

    html = table.to_html(float_format=float_format, formatters=formatters)

    if header_rows is not None:
        # Count the number of columns for the text to span
        n_cols = html.split("<thead>")[1].split("</thead>")[0].count("<th>")

        # Generate the HTML for the extra rows
        rows = ""
        for name, value in header_rows.items():
            rows += (
                '\n    <tr style="text-align: right;"><th>%s</th>'
                + "<td colspan=%d>%s</td></tr>"
            ) % (name, n_cols, value)

        # Inject the new HTML
        html = html.replace("<thead>", "<thead>" + rows)

    display(HTML(html))

ret_SPY_yf = df_SPY_yf['Close'].pct_change()
ret_QQQ_yf = df_QQQ_yf['Close'].pct_change()
ret_SPY_yf.name = 'SPY'
ret_QQQ_yf.name = 'QQQ'

show_worst_drawdown_periods(ret_SPY_yf, top=10)
show_worst_drawdown_periods(ret_QQQ_yf, top=10)
drawdown 테이블에서 Net drawdown in %는 고점 대비 주가가 얼마나 하락하였는지 %로 나타낸 것이고, Peak date는 주가가 고점을 찍은 날, Valley date는 주가가 저점을 찍은 날, Recovery date는 주가가 전고점을 회복한 날, Duration은 주가가 전고점을 회복하는데 까지 걸린 일수(영업일 기준 카운트)를 의미한다.
먼저 SPY의 drawdown 테이블을 살펴보자.
| Worst drawdown periods | Net drawdown in % | Peak date | Valley date | Recovery date | Duration |
|---|---|---|---|---|---|
| 1 | 55.19 | 2007-10-09 | 2009-03-09 | 2012-08-16 | 1268 |
| 2 | 47.52 | 2000-03-24 | 2002-10-09 | 2006-10-26 | 1720 |
| 3 | 33.72 | 2020-02-19 | 2020-03-23 | 2020-08-10 | 124 |
| 4 | 19.35 | 2018-09-20 | 2018-12-24 | 2019-04-12 | 147 |
| 5 | 19.03 | 1998-07-20 | 1998-08-31 | 1998-11-23 | 91 |
| 6 | 18.22 | 2022-01-03 | 2022-05-19 | NaT | |
| 7 | 13.02 | 2015-07-20 | 2016-02-11 | 2016-04-18 | 196 |
| 8 | 11.7 | 1999-07-16 | 1999-10-15 | 1999-11-17 | 89 |
| 9 | 11.2 | 1997-10-07 | 1997-10-27 | 1997-12-05 | 44 |
| 10 | 10.1 | 2018-01-26 | 2018-02-08 | 2018-08-06 | 137 |
- SPY의 경우 금융주가 다수 포함되어 있기 때문에 2008년 금융위기 때의 하락이 가장 큰 것을 볼 수 있다.
- 두번째로 큰 하락은 2000년대 닷컴 버블 시기였고, 세번째로 큰 하락은 2020년 3월의 코로나 폭락이었다.
- 지금의 하락은 역사적으로 보았을 때 여섯 번째로 큰 하락이다. S&P500은 생각보다 많이 빠지진 않았다.
- 2008년 금융위기와 닷컴 버블 시기를 제외하고는 전고점을 회복하는데까지 걸린 기간이 보통 6개월~1년 정도라는 것을 알 수 있다.
다음으로 QQQ의 drawdown 테이블을 살펴보자.
| Worst drawdown periods | Net drawdown in % | Peak date | Valley date | Recovery date | Duration |
|---|---|---|---|---|---|
| 1 | 82.96 | 2000-03-27 | 2002-10-09 | 2015-02-20 | 3890 |
| 2 | 28.72 | 2021-12-27 | 2022-05-24 | NaT | |
| 3 | 28.56 | 2020-02-19 | 2020-03-16 | 2020-06-03 | 76 |
| 4 | 22.8 | 2018-08-29 | 2018-12-24 | 2019-04-12 | 163 |
| 5 | 16.1 | 2015-12-01 | 2016-02-09 | 2016-07-27 | 172 |
| 6 | 15.47 | 2000-01-03 | 2000-01-06 | 2000-01-19 | 13 |
| 7 | 13.94 | 2015-07-20 | 2015-08-25 | 2015-10-28 | 73 |
| 8 | 12.75 | 2020-09-02 | 2020-09-23 | 2020-12-01 | 65 |
| 9 | 11.91 | 1999-04-26 | 1999-05-25 | 1999-06-21 | 41 |
| 10 | 11.81 | 1999-07-16 | 1999-08-10 | 1999-08-25 | 29 |
- QQQ의 경우 닷컴 버블 시기에 어마어마한 대폭락을 경험했다. 전고점까지 회복하는데도 15년이라는 기나긴 시간이 소요되었다.
- 두번째로 큰 하락은 현재 진행중이고, 세번째로 큰 하락은 코로나 때의 하락이었다.
- SPY와는 다르게 2008년 금융위기때의 하락은 하락률 top 10안에 들지 않았다.
- 닷컴버블을 제외하면 보통 1년 이내에 전고점을 회복했다는 것을 알 수 있다.
4. 그래서, 지금이니?
역사적으로 보았을 때 특이점이라고 할 만한 사건(ex. 닷컴 버블, 2008년 금융위기)가 아닌 경우 전고점을 회복하는데 1년정도면 충분했다. 하지만 관측 포인트 수가 매우 적기 때문에 이런 특이점이 또 발생하지 않을 것이라고 단정짓기도 어렵다. 그래도 시계열을 길게 잡고 갈 수 있는 연금 계좌 같은 곳에 넣는 것이라면 지금을 매수 타이밍으로 잡아보는 것도 나쁘지 않을 것 같다는 생각이 든다.
이 글은 특정 주식에 대한 매수 매도 추천이 아닙니다.
증권투자는 반드시 본인의 책임하에 하여야 하며
여유자금으로 분산투자 하는 것이 좋습니다.