FRED 데이터로 경기침체(recession) 예측하기 - (2) 모델링
1. 들어가며
이전 글에서는 경기침체(Recession)의 정의와 경기침체 예측에 활용할 수 있는 다양한 지표들을 살펴보았다.
FRED 데이터로 경기침체(recession) 예측하기 - (1) 데이터 탐색
1. 잘 모르겠고, 아무튼 경기침체 때문이야 요즘 나오는 뉴스 제목을 보면 "경기침체 우려에 ~ 폭락" 이라는 말이 자주 등장한다. 사실 이유는 잘 모르겠는데 뭐라도 둘러대기는 해야 하니까 자꾸
psystat.tistory.com
이번 글에서는 이전 글에서 살펴본 지표들을 이용하여 경기침체 예측 모델을 만들어보려고 한다. 먼저 FRED 데이터를 가져온 후, 각 변수들과 타겟 변수인 경기침체 여부의 관계를 살펴볼 것이다. 그런 다음 타겟 변수를 재정의하고, 경기침체 예측 모델 만들어볼 것이다. 데이터 수집부터 모델링까지 모든 과정은 python을 이용하여 진행하였고, 퀀트 투자를 위한 머신러닝 딥러닝 알고리듬 트레이딩 2/e 10장의 내용을 참고하여 작성하였다.1
2. 데이터 수집
먼저 이전 글에서 살펴보았던 FRED에서 데이터를 가져와야 하는데, pandas_datareader.data를 이용하여 FRED 데이터를 가져올 수 있다.
import pandas as pd
import numpy as np
import pandas_datareader.data as web

import matplotlib.pyplot as plt
import plotly.express as px
import seaborn as sns
%matplotlib inline
sns.set_style('whitegrid')
이전 글에서 살펴보았던 지표들을 'FRED 변수명':'사용할 변수명'의 딕셔너리로 만들어 놓은 후, 데이터를 불러온 다음 rename을 할 때 사용하였다.
DataReader(indicator_list, 'fred', 'start_date', 'end_date')DataReader 함수에 변수 list, 'fred', '시작일자', '종료일자' 순서로 값을 넣으면 되는데, NBER Recession 지표가 1854년 데이터부터 제공되고 있어서 1854년 ~ 2022년 6월 기간의 데이터를 가져왔다. 최근 뉴스 기사에 PCE(Personal Consumption Expenditures) 지표에 대한 언급도 많은 것 같아2 PCE와 Core PCE도 추가해보았다.
indicators = {
'JHDUSRGDPBR':'Recession_GDP',
'USREC': 'Recession_NBER',
'T10Y3M': 'Yield_Spread_10Y3M',
'T10Y2Y': 'Yield_Spread_10Y2Y',
'CPIAUCSL': 'CPI',
'CPILFESL': 'Core_CPI',
'PPIACO': 'PPI',
'PCE': 'PCE', # Personal Consumption Expenditures
'DPCCRC1M027SBEA': 'Core_PCE', # Personal consumption expenditures excluding food and energy
'DCOILWTICO': 'WTI',
'UNRATE': 'Unemployment_Rate',
'NROU': 'Natural_Unemployment_Rate',
'HOUST' : 'New_Housing_Units',
'CSUSHPINSA': 'Case_Shiller',
'NFCI': 'NFCI',
'NFCINONFINLEVERAGE': 'NFCI_Leverage',
'UMCSENT': 'UMC_Sentiment'
}

data = web.DataReader(indicators.keys(), 'fred', '18540101', '20220630')
data = data.rename(columns=indicators)
data.info()

<class 'pandas.core.frame.DataFrame'>
DatetimeIndex: 13912 entries, 1854-12-01 to 2022-06-30
Data columns (total 17 columns):
 #   Column                     Non-Null Count  Dtype
---  ------                     --------------  -----
 0   Recession_GDP              217 non-null    float64
 1   Recession_NBER             2011 non-null   float64
 2   Yield_Spread_10Y3M         10127 non-null  float64
 3   Yield_Spread_10Y2Y         11518 non-null  float64
 4   CPI                        906 non-null    float64
 5   Core_CPI                   786 non-null    float64
 6   PPI                        1314 non-null   float64
 7   PCE                        761 non-null    float64
 8   Core_PCE                   761 non-null    float64
 9   WTI                        9196 non-null   float64
 10  Unemployment_Rate          894 non-null    float64
 11  Natural_Unemployment_Rate  294 non-null    float64
 12  New_Housing_Units          761 non-null    float64
 13  Case_Shiller               424 non-null    float64
 14  NFCI                       2686 non-null   float64
 15  NFCI_Leverage              2686 non-null   float64
 16  UMC_Sentiment              625 non-null    float64
dtypes: float64(17)
memory usage: 1.9 MB
각 변수별로 데이터가 존재하는 기간을 살펴보자.
df_st_dt = pd.DataFrame.from_dict(
    {col: [data[col].dropna().index[0].strftime('%Y%m%d')] for col in indicators.values()},
    orient='index',
    columns=['START_DATE']).sort_values('START_DATE')

df_end_dt = pd.DataFrame.from_dict(
    {col: [data[col].dropna().index[-1].strftime('%Y%m%d')] for col in indicators.values()},
    orient='index',
    columns=['END_DATE']).sort_values('END_DATE')

pd.concat([df_st_dt, df_end_dt], axis=1)
지금의 상황이 1970년대와 비슷하다는 의견이 많이 나오고 있어서3 1970년대 초반 데이터까지는 포함시켜보고 싶은데, 장단기금리차(10년-2년, 10년-3개월), WTI 원유 가격, Case-Shiller 미국 주택가격지수가 그 이후 기간의 데이터만 제공되고 있다. 또한, Case-Shiller 미국 주택가격지수는 분기 단위로 제공되어 가장 최근 데이터가 2022년 4월 기준 데이터이다. 해당 변수들이 경기침체 여부를 예측하는데 크게 도움이 되지 않거나, 1970년대 데이터까지 제공되고 있는 다른 변수들 중에 상관성이 높은 변수들이 있다면, 이 변수들은 제외하고 모델링을 하는 것도 생각해봐야 할 것 같다.
3. 각 변수에 대한 단변량 탐색
3.1. 타겟변수(Recession 여부)
먼저 타겟변수로 NBER Recession 지표를 사용할지 아니면 GDP based Recession 지표를 사용할지 정해보자.
#### 경기침체 여부 NBER
data.Recession_NBER.dropna() # 월 1회 산출

DATE
1854-12-01    1.0
1855-01-01    0.0
1855-02-01    0.0
1855-03-01    0.0
1855-04-01    0.0
             ...
2022-02-01    0.0
2022-03-01    0.0
2022-04-01    0.0
2022-05-01    0.0
2022-06-01    0.0
Name: Recession_NBER, Length: 2011, dtype: float64
NBER Recession 지표는 월 1회 주기로 매월 1일에 제공되고 있고, 1854-12-01~2022-06-01 기간동안 제공되고 있다.
#### 경기침체 여부 GDP based
data.Recession_GDP.dropna() # 분기 1회 산출 - 1월,4월,7월,10월

DATE
1967-10-01    0.0
1968-01-01    0.0
1968-04-01    0.0
1968-07-01    0.0
1968-10-01    0.0
             ...
2020-10-01    0.0
2021-01-01    0.0
2021-04-01    0.0
2021-07-01    0.0
2021-10-01    0.0
Name: Recession_GDP, Length: 217, dtype: float64
반면, GDP based Recession 지표는 분기 1회 주기로 제공되며, 1월/4월/7월/10월에 데이터가 들어가 있는 것을 확인할 수 있다. 데이터는 1967-01-01~2021-10-01 기간동안 제공되고 있다. 각 경기침체 지표가 표시하는 경기침체 구간도 확인해보자.
df_rec = data[['Recession_NBER']].dropna()
df_rec['Recession_NBER_shift'] = df_rec['Recession_NBER'].shift(1)
df_rec = df_rec.dropna()
df_rec = df_rec.iloc[1:]
df_rec_nber = pd.concat([pd.Series(df_rec[(df_rec.Recession_NBER==1) &
                                            (df_rec.Recession_NBER_shift==0)].index, name='START_DATE'),
                        pd.Series(df_rec[(df_rec.Recession_NBER==0) &
                                            (df_rec.Recession_NBER_shift==1)].index, name='END_DATE')],
                                            axis=1)

df_rec = data[['Recession_GDP']].dropna()
df_rec['Recession_GDP_shift'] = df_rec['Recession_GDP'].shift(1)
df_rec = df_rec.dropna()
df_rec = df_rec.iloc[1:]
df_rec_gdp = pd.concat([pd.Series(df_rec[(df_rec.Recession_GDP==1) &
                                            (df_rec.Recession_GDP_shift==0)].index, name='START_DATE'),
                        pd.Series(df_rec[(df_rec.Recession_GDP==0) &
                                            (df_rec.Recession_GDP_shift==1)].index, name='END_DATE')],
                                            axis=1)

df_rec_nber = df_rec_nber[df_rec_nber.START_DATE>='19671001'].reset_index(drop=True)
df_rec_nber['DIFF_DATE'] = pd.to_datetime(df_rec_nber['END_DATE'])-pd.to_datetime(df_rec_nber['START_DATE'])
df_rec_gdp['DIFF_DATE'] = pd.to_datetime(df_rec_gdp['END_DATE'])-pd.to_datetime(df_rec_gdp['START_DATE'])

df_rec_nber
df_rec_gdp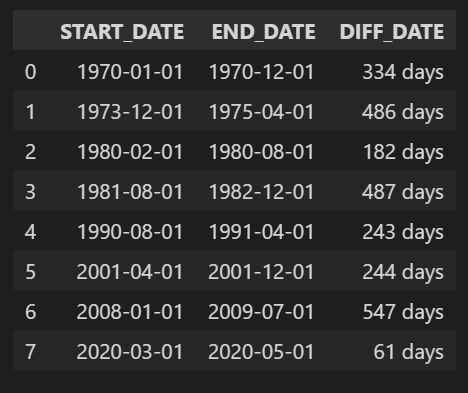

GDP based Recession 지표는 해당 분기 시작월에 경기침체 여부를 표시하고, 그 분기 전체를 경기침체 구간으로 보기 때문에 NBER Recession 지표보다 경기침체 구간이 길게 나타나는 것을 볼 수 있다. 데이터 제공 기간과 제공 주기를 볼 때, NBER Recession 지표를 이용하는 게 더 나아 보인다.
경기침체 예측에 사용할 변수들의 제공주기와 기간도 살펴보자.
3.2. 장단기금리차
#### 장단기 금리 스프레드 10년 - 3개월
data.Yield_Spread_10Y3M.dropna() # 매영업일 마다 산출

DATE
1982-01-04    2.32
1982-01-05    2.24
1982-01-06    2.43
1982-01-07    2.46
1982-01-08    2.50
              ...
2022-06-24    1.40
2022-06-27    1.41
2022-06-28    1.41
2022-06-29    1.32
2022-06-30    1.26
Name: Yield_Spread_10Y3M, Length: 10127, dtype: float64

#### 장단기 금리 스프레드 10년 - 2년
data.Yield_Spread_10Y2Y.dropna() # 매영업일 마다 산출

DATE
1976-06-01    0.68
1976-06-02    0.71
1976-06-03    0.70
1976-06-04    0.77
1976-06-07    0.79
              ...
2022-06-24    0.09
2022-06-27    0.12
2022-06-28    0.10
2022-06-29    0.04
2022-06-30    0.06
Name: Yield_Spread_10Y2Y, Length: 11518, dtype: float64
3.3. 물가관련 지표
#### CPI
data.CPI.dropna() # 월 1회

DATE
1947-01-01     21.480
1947-02-01     21.620
1947-03-01     22.000
1947-04-01     22.000
1947-05-01     21.950
               ...
2022-02-01    284.182
2022-03-01    287.708
2022-04-01    288.663
2022-05-01    291.474
2022-06-01    295.328
Name: CPI, Length: 906, dtype: float64

#### Core CPI
data.Core_CPI.dropna() # 월 1회

DATE
1957-01-01     28.500
1957-02-01     28.600
1957-03-01     28.700
1957-04-01     28.800
1957-05-01     28.800
               ...
2022-02-01    287.878
2022-03-01    288.811
2022-04-01    290.455
2022-05-01    292.289
2022-06-01    294.354
Name: Core_CPI, Length: 786, dtype: float64

#### PPI
data.PPI.dropna() # 월 1회

DATE
1913-01-01     12.100
1913-02-01     12.000
1913-03-01     12.000
1913-04-01     12.000
1913-05-01     11.900
               ...
2022-02-01    252.660
2022-03-01    259.969
2022-04-01    265.385
2022-05-01    273.270
2022-06-01    282.360
Name: PPI, Length: 1314, dtype: float64

#### PCE
data.PCE.dropna() # 월 1회

DATE
1959-01-01      306.1
1959-02-01      309.6
1959-03-01      312.7
1959-04-01      312.2
1959-05-01      316.1
               ...
2022-01-01    16543.3
2022-02-01    16635.8
2022-03-01    16831.2
2022-04-01    16923.9
2022-05-01    16956.6
Name: PCE, Length: 761, dtype: float64

#### Core PCE
data.Core_PCE.dropna() # 월 1회

DATE
1959-01-01      221.7
1959-02-01      225.5
1959-03-01      229.6
1959-04-01      229.3
1959-05-01      231.8
               ...
2022-01-01    14539.0
2022-02-01    14625.8
2022-03-01    14731.4
2022-04-01    14840.1
2022-05-01    14840.3
Name: Core_PCE, Length: 761, dtype: float64

#### WTI
data.WTI.dropna() # 일별

DATE
1986-01-02     25.56
1986-01-03     26.00
1986-01-06     26.53
1986-01-07     25.85
1986-01-08     25.87
               ...
2022-06-24    109.07
2022-06-27    111.44
2022-06-28    113.66
2022-06-29    111.65
2022-06-30    107.76
Name: WTI, Length: 9196, dtype: float64
3.4. 실업률 지표
#### Unemployment Rate
data.Unemployment_Rate.dropna() # 월 1회

DATE
1948-01-01    3.4
1948-02-01    3.8
1948-03-01    4.0
1948-04-01    3.9
1948-05-01    3.5
             ...
2022-02-01    3.8
2022-03-01    3.6
2022-04-01    3.6
2022-05-01    3.6
2022-06-01    3.6
Name: Unemployment_Rate, Length: 894, dtype: float64

#### Natural Unemployment Rate
data.Natural_Unemployment_Rate.dropna() # 분기 1회

DATE
1949-01-01    5.255053
1949-04-01    5.261516
1949-07-01    5.268013
1949-10-01    5.274564
1950-01-01    5.281182
                ...
2021-04-01    4.463892
2021-07-01    4.456865
2021-10-01    4.450651
2022-01-01    4.445137
2022-04-01    4.440214
Name: Natural_Unemployment_Rate, Length: 294, dtype: float64
3.5. 주택관련 지표
#### 신규주택 착공건수
data.New_Housing_Units.dropna() # 월 1회 산출

DATE
1959-01-01    1657.0
1959-02-01    1667.0
1959-03-01    1620.0
1959-04-01    1590.0
1959-05-01    1498.0
               ...
2022-01-01    1666.0
2022-02-01    1777.0
2022-03-01    1716.0
2022-04-01    1810.0
2022-05-01    1549.0
Name: New_Housing_Units, Length: 761, dtype: float64

#### Case Shiler 주택가격지수
data.Case_Shiller.dropna() # 얼 1회 산출

DATE
1987-01-01     63.735
1987-02-01     64.134
1987-03-01     64.470
1987-04-01     64.974
1987-05-01     65.549
               ...
2021-12-01    278.694
2022-01-01    282.069
2022-02-01    287.304
2022-03-01    294.721
2022-04-01    300.845
Name: Case_Shiller, Length: 424, dtype: float64
3.6. 기타 지표
#### 시카고 연준 금융 상황 지수
data.NFCI.dropna() # 주 1회 산출

DATE
1971-01-08    0.53554
1971-01-15    0.58153
1971-01-22    0.63776
1971-01-29    0.69923
1971-02-05    0.76214
               ...
2022-05-27   -0.21570
2022-06-03   -0.20040
2022-06-10   -0.18174
2022-06-17   -0.15966
2022-06-24   -0.14310
Name: NFCI, Length: 2686, dtype: float64

#### NFCI 비금융 레버리지 서브인덱스
data.NFCI_Leverage.dropna() # 주 1회 산출

DATE
1971-01-08   -1.43115
1971-01-15   -1.44750
1971-01-22   -1.46226
1971-01-29   -1.47510
1971-02-05   -1.48574
               ...
2022-05-27   -1.19059
2022-06-03   -1.18021
2022-06-10   -1.17012
2022-06-17   -1.16027
2022-06-24   -1.15065
Name: NFCI_Leverage, Length: 2686, dtype: float64

#### 미시간 대학교 소비자 심리지수
data.UMC_Sentiment.dropna() # 월 1회 산출

DATE
1952-11-01    86.2
1953-02-01    90.7
1953-08-01    80.8
1953-11-01    80.7
1954-02-01    82.0
              ...
2022-01-01    67.2
2022-02-01    62.8
2022-03-01    59.4
2022-04-01    65.2
2022-05-01    58.4
Name: UMC_Sentiment, Length: 625, dtype: float64
4. 데이터 전처리
분석을 진행하기 전에 몇 가지 전처리 작업을 진행해주었다.
4.1. 월단위로 데이터 리샘플링
data_resampled = data.ffill().resample('M').last()
data_resampled.info()

<class 'pandas.core.frame.DataFrame'>
DatetimeIndex: 2011 entries, 1854-12-31 to 2022-06-30
Freq: M
Data columns (total 17 columns):
 #   Column                     Non-Null Count  Dtype
---  ------                     --------------  -----
 0   Recession_GDP              657 non-null    float64
 1   Recession_NBER             2011 non-null   float64
 2   Yield_Spread_10Y3M         486 non-null    float64
 3   Yield_Spread_10Y2Y         553 non-null    float64
 4   CPI                        906 non-null    float64
 5   Core_CPI                   786 non-null    float64
 6   PPI                        1314 non-null   float64
 7   PCE                        762 non-null    float64
 8   Core_PCE                   762 non-null    float64
 9   WTI                        438 non-null    float64
 10  Unemployment_Rate          894 non-null    float64
 11  Natural_Unemployment_Rate  882 non-null    float64
 12  New_Housing_Units          762 non-null    float64
 13  Case_Shiller               426 non-null    float64
 14  NFCI                       618 non-null    float64
 15  NFCI_Leverage              618 non-null    float64
 16  UMC_Sentiment              836 non-null    float64
dtypes: float64(17)
memory usage: 282.8 KB
4.2. 증감률 지표 계산하기
전년 동기대비(YoY), 전반기 대비(HoH), 전분기 대비(QoQ), 전월 대비(MoM) 증감률을 계산하여 새로운 변수로 추가하였다.
data_resampled = data_resampled.assign(

    CPI_YoY=data_resampled.CPI.pct_change(12),
    Core_CPI_YoY=data_resampled.Core_CPI.pct_change(12),
    PPI_YoY=data_resampled.PPI.pct_change(12),
    PCE_YoY=data_resampled.PCE.pct_change(12),
    Core_PCE_YoY=data_resampled.Core_PCE.pct_change(12),
    WTI_YoY=data_resampled.WTI.pct_change(12),
    Unemployment_Rate_YoY=data_resampled.Unemployment_Rate.pct_change(12),
    Natural_Unemployment_Rate_YoY=data_resampled.Natural_Unemployment_Rate.pct_change(12),
    New_Housing_Units_YoY=data_resampled.New_Housing_Units.pct_change(12),
    Case_Shiller_YoY=data_resampled.Case_Shiller.pct_change(12),
    UMC_Sentiment_YoY=data_resampled.UMC_Sentiment.pct_change(12),

    CPI_HoH=data_resampled.CPI.pct_change(6),
    Core_CPI_HoH=data_resampled.Core_CPI.pct_change(6),
    PPI_HoH=data_resampled.PPI.pct_change(6),
    PCE_HoH=data_resampled.PCE.pct_change(6),
    Core_PCE_HoH=data_resampled.Core_PCE.pct_change(6),
    WTI_HoH=data_resampled.WTI.pct_change(6),
    Unemployment_Rate_HoH=data_resampled.Unemployment_Rate.pct_change(6),
    Natural_Unemployment_Rate_HoH=data_resampled.Natural_Unemployment_Rate.pct_change(6),
    New_Housing_Units_HoH=data_resampled.New_Housing_Units.pct_change(6),
    Case_Shiller_HoH=data_resampled.Case_Shiller.pct_change(6),
    UMC_Sentiment_HoH=data_resampled.UMC_Sentiment.pct_change(6),

    CPI_QoQ=data_resampled.CPI.pct_change(3),
    Core_CPI_QoQ=data_resampled.Core_CPI.pct_change(3),
    PPI_QoQ=data_resampled.PPI.pct_change(3),
    PCE_QoQ=data_resampled.PCE.pct_change(3),
    Core_PCE_QoQ=data_resampled.Core_PCE.pct_change(3),
    WTI_QoQ=data_resampled.WTI.pct_change(3),
    Unemployment_Rate_QoQ=data_resampled.Unemployment_Rate.pct_change(3),
    Natural_Unemployment_Rate_QoQ=data_resampled.Natural_Unemployment_Rate.pct_change(3),
    New_Housing_Units_QoQ=data_resampled.New_Housing_Units.pct_change(3),
    Case_Shiller_QoQ=data_resampled.Case_Shiller.pct_change(3),
    UMC_Sentiment_QoQ=data_resampled.UMC_Sentiment.pct_change(3),

    CPI_MoM=data_resampled.CPI.pct_change(1),
    Core_CPI_MoM=data_resampled.Core_CPI.pct_change(1),
    PPI_MoM=data_resampled.PPI.pct_change(1),
    PCE_MoM=data_resampled.PCE.pct_change(1),
    Core_PCE_MoM=data_resampled.Core_PCE.pct_change(1),
    WTI_MoM=data_resampled.WTI.pct_change(1),
    Unemployment_Rate_MoM=data_resampled.Unemployment_Rate.pct_change(1),
    Natural_Unemployment_Rate_MoM=data_resampled.Natural_Unemployment_Rate.pct_change(1),
    New_Housing_Units_MoM=data_resampled.New_Housing_Units.pct_change(1),
    Case_Shiller_MoM=data_resampled.Case_Shiller.pct_change(1),
    UMC_Sentiment_MoM=data_resampled.UMC_Sentiment.pct_change(1)
                                       )
data_resampled = data_resampled.dropna()
data_resampled.info()
<class 'pandas.core.frame.DataFrame'>
DatetimeIndex: 414 entries, 1988-01-31 to 2022-06-30
Freq: M
Data columns (total 61 columns):
# Column Non-Null Count Dtype
--- ------ -------------- -----
0 Recession_GDP 414 non-null float64
1 Recession_NBER 414 non-null float64
2 Yield_Spread_10Y3M 414 non-null float64
3 Yield_Spread_10Y2Y 414 non-null float64
4 CPI 414 non-null float64
5 Core_CPI 414 non-null float64
6 PPI 414 non-null float64
7 PCE 414 non-null float64
8 Core_PCE 414 non-null float64
9 WTI 414 non-null float64
10 Unemployment_Rate 414 non-null float64
11 Natural_Unemployment_Rate 414 non-null float64
12 New_Housing_Units 414 non-null float64
13 Case_Shiller 414 non-null float64
14 NFCI 414 non-null float64
15 NFCI_Leverage 414 non-null float64
16 UMC_Sentiment 414 non-null float64
17 CPI_YoY 414 non-null float64
18 Core_CPI_YoY 414 non-null float64
...
59 Case_Shiller_MoM 414 non-null float64
60 UMC_Sentiment_MoM 414 non-null float64
dtypes: float64(61)
memory usage: 200.5 KB5. 입력변수와 타겟변수의 관계 파악하기
label='Recession_NBER'
label_drop = 'Recession_GDP'
features = [col for col in data_resampled if col not in [label, label_drop]]

pct_cols = ['CPI', 'Core_CPI', 'PPI', 'PCE', 'Core_PCE', 'WTI', 'Unemployment_Rate', 'Natural_Unemployment_Rate', 'New_Housing_Units', 'Case_Shiller', 'UMC_Sentiment']
non_pct_cols = ['Yield_Spread_10Y3M', 'Yield_Spread_10Y2Y', 'NFCI', 'NFCI_Leverage']

features_org = pct_cols + non_pct_cols
features_YoY = [f'{col}_YoY' for col in pct_cols] + non_pct_cols
features_HoH = [f'{col}_HoH' for col in pct_cols] + non_pct_cols
features_QoQ = [f'{col}_QoQ' for col in pct_cols] + non_pct_cols
features_MoM = [f'{col}_MoM' for col in pct_cols] + non_pct_cols
5.1. Mutual Information
입력변수와 타겟변수의 관계를 파악하기 위해 가장 먼저 해본 것은 퀀트 투자를 위한 머신러닝 딥러닝 알고리듬 트레이딩 2/e 10장에 소개된 mutual information 계산이다. scikit-learn feature_selection의 mutual_info_classif를 이용하면 mutual information을 계산할 수 있다. mutual information에 대한 scikit-learn 공식문서의 설명은 다음과 같다.
sklearn.feature_selection.mutual_info_classif(X, y, *, discrete_features='auto', n_neighbors=3, copy=True, random_state=None)Estimate mutual information for a discrete target variable.
Mutual information (MI) [1] between two random variables is a non-negative value, which measures the dependency between the variables. It is equal to zero if and only if two random variables are independent, and higher values mean higher dependency.
The function relies on nonparametric methods based on entropy estimation from k-nearest neighbors distances as described in [2] and [3]. Both methods are based on the idea originally proposed in [4].
It can be used for univariate features selection, read more in the User Guide.
타겟변수인 Recession_NBER을 n개월 만큼 shift하여 현재시점으로 부터 n개월 후의 경기침체 여부와 각 변수 사이의 mutual information을 계산한 후 시각화해보았다.
#### mutual information 계산
from sklearn.feature_selection import mutual_info_classif
mi = []
months = list(range(1, 25))
for month in months:
    df_ = data_resampled.copy()
    df_[label] = df_[label].shift(-month) # 해당시점으로부터 n개월 후의 경기침체 여부
    df_ = df_.dropna()
    # 해당시점으로부터 n개월 후의 경기침체 여부와 각 피처 사이의 mutual information
    mi.append(mutual_info_classif(df_.loc[:, features], df_[label], random_state=42))
mi = pd.DataFrame(mi, columns=features, index=months)

fig, ax = plt.subplots(figsize=(20, 15))
cmap = sns.diverging_palette(10, 133, as_cmap=True)
sns.heatmap(mi.T*100, cmap=cmap, center=0, ax=ax, annot=True, fmt='.1f', cbar=False)
ax.set_xlabel('Lead Time (Months)')
ax.set_title('Mutual Information between Indicators and Recession by Lead Time')
fig.tight_layout();
물가 관련지표 중 CPI, Core CPI, PCE, Core PCE와 실업률 관련 지표 중 Natural Unemployment Rate(자연실업률)이 대체로 1~24개월 기간 전반에 걸쳐 타겟변수와 의존성이 높은 것으로 나타났다. Case-Shiller 미국 주택가격 지수의 경우 22~24개월 이후 경기침체 여부와의 의존성이 다른 기간에 비해 높은 것으로 보아 장기 예측에 조금 더 효과적인 지표로 보인다. NFCI는 비교적 단기예측에 사용하는 것이 좋아 보이고, NFCI Leverage는 아주 단기나 아주 장기보다는 12개월 전후의 경기침체 여부를 예측할 때 사용하는 것이 효과적일 것 같다.
전반적으로 증감률 변수보다는 가공하지 않은 원 변수가 타겟변수와의 의존성이 더 높은 것으로 나타났다. 증감률 변수 중에는 전년 동기 대비 증감률 변수들이 대체로 다른 기간 대비 증감률 변수들보다는 타겟변수와의 의존성이 높게 나타났다. 자연실업률의 전분기 대비 증감률(Natural_Unemployment_Rate_QoQ)이 12개월~24개월 이후 경기침체 여부와의 의존성이 높게 나온 것이 특이사항이다.
5.2. Feature Importance using Random Forest
다음으로 해본 것은 랜덤포레스트 모형을 학습시켜 변수 중요도를 뽑아본 것이다. 관측값의 수가 너무 적어서 부스팅 보다는 배깅 모형이 더 안정적일 것 같아 랜덤포레스트 모형을 선택해보았다.
from sklearn.ensemble import RandomForestClassifier
#### feature importance 계산
imp = []
months = list(range(1, 25))
for month in months:
    df_ = data_resampled.copy()
    df_[label] = df_[label].shift(-month) # 해당시점으로부터 n개월 후의 경기침체 여부
    df_ = df_.dropna()
    # 해당시점으로부터 n개월 후의 경기침체 여부와 각 피처 사이의 feature importance
    model = RandomForestClassifier(n_estimators=100, random_state=42)
    model.fit(X=df_.loc[:, features], y=df_[label])
    imp.append(model.feature_importances_)
imp = pd.DataFrame(imp, columns=model.feature_names_in_, index=months)

fig, ax = plt.subplots(figsize=(20, 15))
cmap = sns.diverging_palette(10, 133, as_cmap=True)
sns.heatmap(imp.T*100, cmap=cmap, center=0, ax=ax, annot=True, fmt='.1f', cbar=False)
ax.set_xlabel('Lead Time (Months)')
ax.set_title('Feature Importance(RF) between Indicators and Recession by Lead Time')
fig.tight_layout();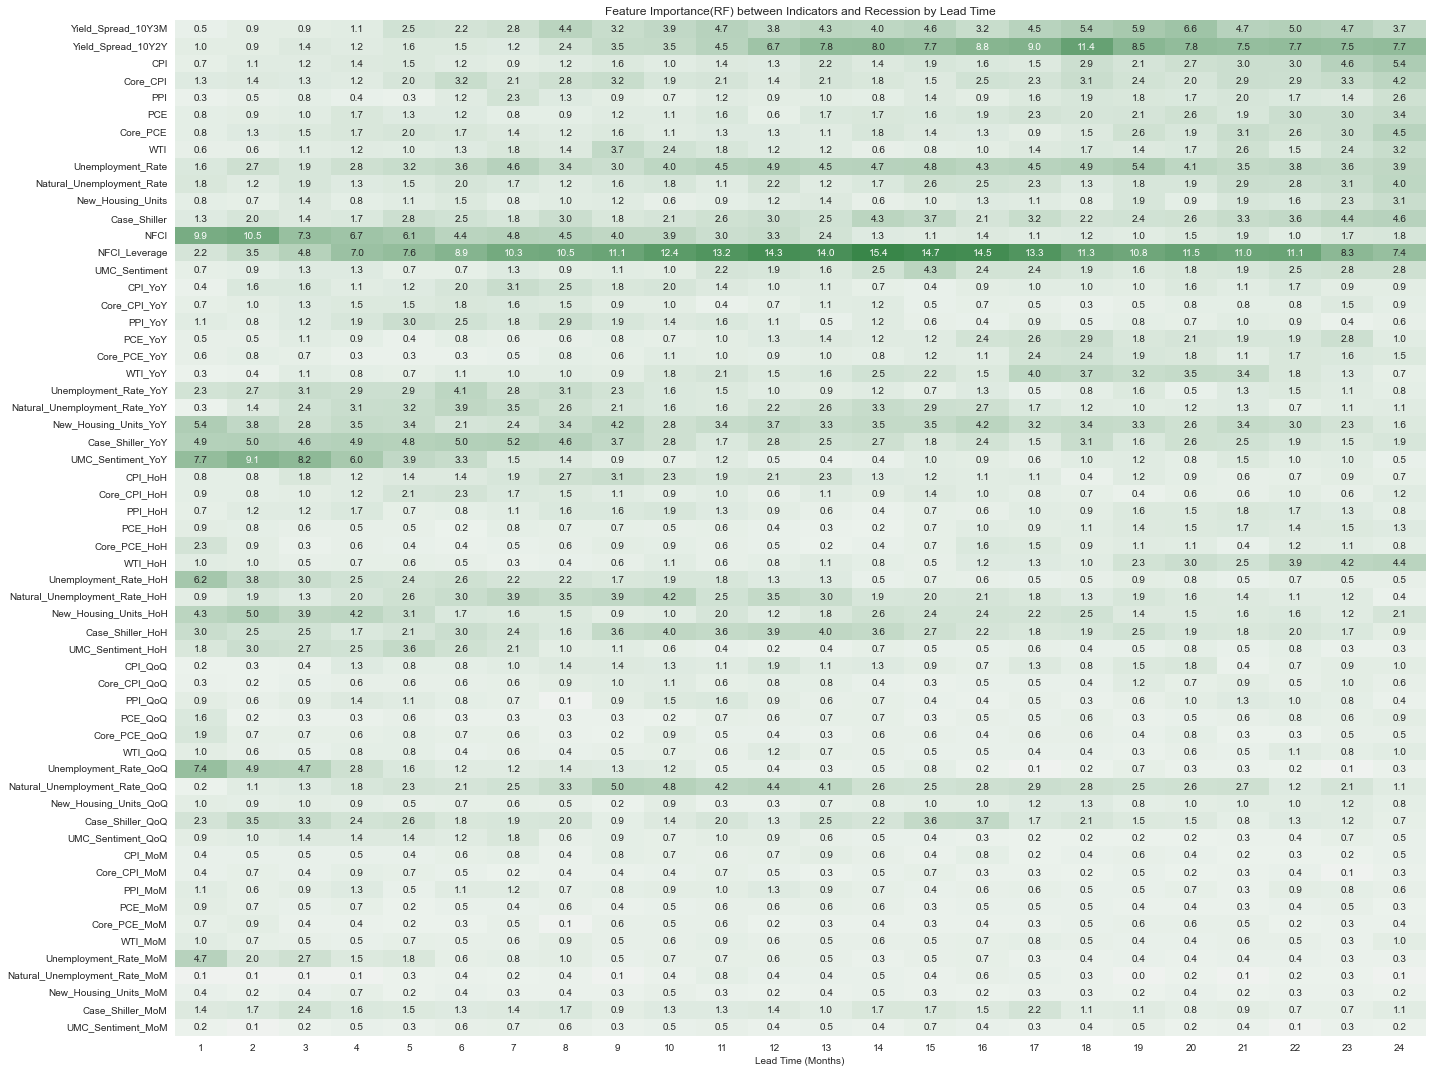
Mutual Infomation과는 다르게 NFCI Leverage를 제외하면 전 기간에 걸쳐 전반적으로 중요도가 높게 나타나는 변수는 없었다. NFCI, UMC_Sentiment_YoY, Unemployment_Rate_QoQ 등이 단기 예측에 도움이 될 것으로 보이기는 한다.
5.3. Permutation Importance
모형의 일반화 성능 향상에 도움이 되는 변수가 무엇인지 파악하려면 Permutation Importance를 보는 것이 좋다. 그런데 데이터의 n수가 매우 작고(n=414), 타겟변수도 시계열의 특정 구간에만 분포하고 있기 때문에 시계열 데이터의 특성을 고려한 timeseries CV를 사용하기 쉽지 않아 보인다.
from sklearn.model_selection import TimeSeriesSplit

tscv = TimeSeriesSplit(n_splits=5)
for i, (train_idx, valid_idx) in enumerate(tscv.split(df_.loc[:, features])):
    X_train = df_.iloc[train_idx, :][features]
    y_train = df_.iloc[train_idx, :][label]
    X_valid = df_.iloc[valid_idx, :][features]
    y_valid = df_.iloc[valid_idx, :][label]
    print(f'---------- {i+1}th split ----------')
    print(f"train start: {y_train.index[0].strftime('%Y-%m-%d')}, train end {y_train.index[-1].strftime('%Y-%m-%d')}, n_train: {X_train.shape[0]}, n_target_train: {y_train.sum()}")
    print(f"valid start: {y_valid.index[0].strftime('%Y-%m-%d')}, valid end {y_valid.index[-1].strftime('%Y-%m-%d')}, n_valid: {X_valid.shape[0]}, n_target_valid: {y_valid.sum()}")

---------- 1th split ----------
train start: 1988-01-31, train end 1993-05-31, n_train: 65, n_target_train: 8.0
valid start: 1993-06-30, valid end 1998-10-31, n_valid: 65, n_target_valid: 0.0
---------- 2th split ----------
train start: 1988-01-31, train end 1998-10-31, n_train: 130, n_target_train: 8.0
valid start: 1998-11-30, valid end 2004-03-31, n_valid: 65, n_target_valid: 8.0
---------- 3th split ----------
train start: 1988-01-31, train end 2004-03-31, n_train: 195, n_target_train: 16.0
valid start: 2004-04-30, valid end 2009-08-31, n_valid: 65, n_target_valid: 18.0
---------- 4th split ----------
train start: 1988-01-31, train end 2009-08-31, n_train: 260, n_target_train: 34.0
valid start: 2009-09-30, valid end 2015-01-31, n_valid: 65, n_target_valid: 0.0
---------- 5th split ----------
train start: 1988-01-31, train end 2015-01-31, n_train: 325, n_target_train: 34.0
valid start: 2015-02-28, valid end 2020-06-30, n_valid: 65, n_target_valid: 2.0
fold를 5개로 나누면 타겟(실제 타겟은 shift를 해서 사용하긴 하지만)에 1이 아예 없는 fold도 발생하게 된다.
from sklearn.model_selection import TimeSeriesSplit

tscv = TimeSeriesSplit(n_splits=3)
for i, (train_idx, valid_idx) in enumerate(tscv.split(df_.loc[:, features])):
    X_train = df_.iloc[train_idx, :][features]
    y_train = df_.iloc[train_idx, :][label]
    X_valid = df_.iloc[valid_idx, :][features]
    y_valid = df_.iloc[valid_idx, :][label]
    print(f'---------- {i+1}th split ----------')
    print(f"train start: {y_train.index[0].strftime('%Y-%m-%d')}, train end {y_train.index[-1].strftime('%Y-%m-%d')}, n_train: {X_train.shape[0]}, n_target_train: {y_train.sum()}")
    print(f"valid start: {y_valid.index[0].strftime('%Y-%m-%d')}, valid end {y_valid.index[-1].strftime('%Y-%m-%d')}, n_valid: {X_valid.shape[0]}, n_target_valid: {y_valid.sum()}")

---------- 1th split ----------
train start: 1988-01-31, train end 1996-03-31, n_train: 99, n_target_train: 8.0
valid start: 1996-04-30, valid end 2004-04-30, n_valid: 97, n_target_valid: 8.0
---------- 2th split ----------
train start: 1988-01-31, train end 2004-04-30, n_train: 196, n_target_train: 16.0
valid start: 2004-05-31, valid end 2012-05-31, n_valid: 97, n_target_valid: 18.0
---------- 3th split ----------
train start: 1988-01-31, train end 2012-05-31, n_train: 293, n_target_train: 34.0
valid start: 2012-06-30, valid end 2020-06-30, n_valid: 97, n_target_valid: 2.0
fold를 3개 정도로 하면 많지는 않지만 타겟 수가 어느 정도 확보되는 것을 볼 수 있다.
5.3.1. Random Forest
from sklearn.inspection import permutation_importance
from sklearn.model_selection import TimeSeriesSplit
from sklearn.metrics import roc_auc_score

from sklearn.inspection import permutation_importance
from sklearn.model_selection import TimeSeriesSplit
from sklearn.metrics import roc_auc_score

permute_imp_rf = []
auc_rf = []
months = list(range(1, 25))
for month in months:

    permute_imp_ = []
    auc_ = []

    df_ = data_resampled.copy()
    df_[label] = df_[label].shift(-month)
    df_ = df_.dropna()

    tscv = TimeSeriesSplit(n_splits=3)
    for train_idx, valid_idx in tscv.split(df_.loc[:, features]):

        X_train = df_.iloc[train_idx, :][features]
        y_train = df_.iloc[train_idx, :][label]
        X_valid = df_.iloc[valid_idx, :][features]
        y_valid = df_.iloc[valid_idx, :][label]
        model = RandomForestClassifier(random_state=42)
        model.fit(X=X_train, y=y_train)
        y_pred = model.predict_proba(X_valid)[:, 1]
        p_imp = permutation_importance(model, X_valid, y_valid,
                                       n_repeats=10,
                                       random_state=0)
        permute_imp_.append(p_imp['importances_mean'])
        auc_.append(roc_auc_score(y_valid, y_pred))

    permute_imp_rf.append(np.mean(permute_imp_, axis=0))
    auc_rf.append(np.mean(auc_, axis=0))
permute_imp_rf = pd.DataFrame(permute_imp_rf, columns=model.feature_names_in_, index=months)

fig, ax = plt.subplots(figsize=(20, 15))
cmap = sns.diverging_palette(10, 133, as_cmap=True)
sns.heatmap(permute_imp.T*100, cmap=cmap, center=0, ax=ax, annot=True, fmt='.1f', cbar=False)
ax.set_xlabel('Lead Time (Months)')
ax.set_title('Permutation importance(RF) between Indicators and Recession by Lead Time')
fig.tight_layout();
permutation importance 값이 음수이면 랜덤하게 섞은 변수가 예측에 더 효과적으로 작용했다는 의미인데, 이 점을 생각해보면 모형의 일반화 성능을 제대로 평가해볼 수 있을지 의문이 든다. 6개월 이내의 단기 예측은 어느 정도 될 것도 같은 느낌이 들지만 18개월 이후 시점에 대한 장기예측은 쉽지 않아 보인다. 각 시점의 경기침체마다 특성이 크게 달라서 예측을 잘 하지 못하는 게 아닌가 하는 생각도 든다. train 데이터로만 mutual information이나 변수 중요도를 살펴보았을 때와는 다르게 원 변수보다는 증감률 변수들(YoY, HoH, QoQ, MoM)이 상대적으로 중요도가 높은 것을 볼 수 있다.
Validation set에서 계산한 AUC도 살펴보자. 각 fold에서 구한 AUC의 평균값을 계산하여 표시하였다.
df_auc_RF = pd.DataFrame(pd.concat([pd.Series([i+1 for i in range(24)], name='Lead Time'),
                        pd.Series(auc_rf, name='AUC')], axis=1))
df_auc_RF.set_index('Lead Time').sort_index(ascending=False).plot.barh(
    figsize=(10, 10),
    title='Averaged AUC(RF) by Lead Time',
    ylabel='AUC',
    xlabel='Lead Time'
     );
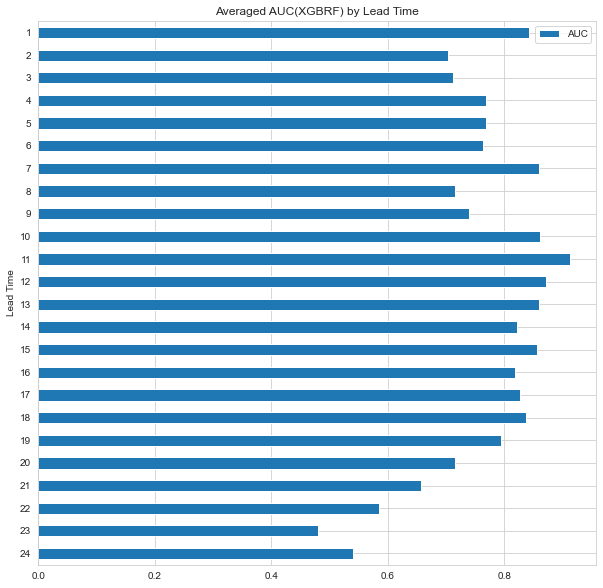
12개월 이후 시점 근방의 경기침체 여부를 예측할 때 성능이 비교적 좋게 나오는 것을 볼 수 있다.
이어서 XGboost와 LightGBM 패키지에서 제공하는 Random Forest classifier와 XGB, LGB 모형의 permutation importance와 Validation AUC를 살펴보았다.
5.3.2. XGBRF
from sklearn.inspection import permutation_importance
from sklearn.model_selection import TimeSeriesSplit
from xgboost import XGBRFClassifier

permute_imp_XGBRF = []
auc_XGBRF = []

months = list(range(1, 25))
for month in months:
    df_ = data_resampled.copy()
    df_[label] = df_[label].shift(-month)
    df_ = df_.dropna()

    permute_imp_ = []
    auc_ = []

    tscv = TimeSeriesSplit(n_splits=3)
    for train_idx, valid_idx in tscv.split(df_.loc[:, features]):

        X_train = df_.iloc[train_idx, :][features]
        y_train = df_.iloc[train_idx, :][label]
        X_valid = df_.iloc[valid_idx, :][features]
        y_valid = df_.iloc[valid_idx, :][label]
        model = XGBRFClassifier(random_state=42)
        model.fit(X=X_train, y=y_train, eval_metric='auc')
        y_pred = model.predict_proba(X_valid)[:, 1]
        p_imp = permutation_importance(model, X_valid, y_valid,
                                       n_repeats=10,
                                       random_state=0)
        permute_imp_.append(p_imp['importances_mean'])
        auc_.append(roc_auc_score(y_valid, y_pred))
    permute_imp_XGBRF.append(np.mean(permute_imp_, axis=0))
    auc_XGBRF.append(np.mean(auc_, axis=0))
permute_imp_XGBRF = pd.DataFrame(permute_imp_XGBRF, columns=model.get_booster().feature_names, index=months)

fig, ax = plt.subplots(figsize=(20, 15))
cmap = sns.diverging_palette(10, 133, as_cmap=True)
sns.heatmap(permute_imp_XGBRF.T*100, cmap=cmap, center=0, ax=ax, annot=True, fmt='.1f', cbar=False)
ax.set_xlabel('Lead Time (Months)')
ax.set_title('Permutation importance(XGBRF) between Indicators and Recession by Lead Time')
fig.tight_layout();
xgboost 패키지에서 제공하는 랜덤포레스트 모델(이 글에서는 XGBRF로 표기)은 scikit learn의 랜덤포레스트 모델과는 다르게 특정 변수들의 종요도가 높게 나타났는데, 단기예측시에 NFCI_Leverage와 UMC_Sentiment_YoY의 중요도가 눈에 띄게 높았다.
df_auc_XGBRF = pd.DataFrame(pd.concat([pd.Series([i+1 for i in range(24)], name='Lead Time'),
                            pd.Series(auc_XGBRF, name='AUC')], axis=1))
df_auc_XGBRF.set_index('Lead Time').sort_index(ascending=False).plot.barh(
    figsize=(10, 10),
    title='Averaged AUC(XGBRF) by Lead Time',
    ylabel='AUC',
    xlabel='Lead Time'
    );
5.3.3. LGBRF
from sklearn.inspection import permutation_importance
from sklearn.model_selection import TimeSeriesSplit
from lightgbm import LGBMClassifier

permute_imp_LGBRF = []
auc_LGBRF = []
months = list(range(1, 25))
for month in months:
    df_ = data_resampled.copy()
    df_[label] = df_[label].shift(-month)
    df_ = df_.dropna()

    permute_imp_ = []
    auc_ = []

    tscv = TimeSeriesSplit(n_splits=3)
    for train_idx, valid_idx in tscv.split(df_.loc[:, features]):

        X_train = df_.iloc[train_idx, :][features]
        y_train = df_.iloc[train_idx, :][label]
        X_valid = df_.iloc[valid_idx, :][features]
        y_valid = df_.iloc[valid_idx, :][label]
        model = LGBMClassifier(boosting_type='rf',
                               bagging_freq=1,
                               bagging_fraction=0.8,
                               random_state=42)
        model.fit(X=X_train, y=y_train, eval_metric='auc')
        y_pred = model.predict_proba(X_valid)[:, 1]

        p_imp = permutation_importance(model, X_valid, y_valid,
                                       n_repeats=10,
                                       random_state=0)
        permute_imp_.append(p_imp['importances_mean'])
        auc_.append(roc_auc_score(y_valid, y_pred))
    permute_imp_LGBRF.append(np.mean(permute_imp_, axis=0))
    auc_LGBRF.append(np.mean(auc_, axis=0))
permute_imp_LGBRF = pd.DataFrame(permute_imp_LGBRF, columns=model.booster_.feature_name(), index=months)

fig, ax = plt.subplots(figsize=(20, 15))
cmap = sns.diverging_palette(10, 133, as_cmap=True)
sns.heatmap(permute_imp_LGBRF.T*100, cmap=cmap, center=0, ax=ax, annot=True, fmt='.1f', cbar=False)
ax.set_xlabel('Lead Time (Months)')
ax.set_title('Permutation importance(LGBRF) between Indicators and Recession by Lead Time')
fig.tight_layout();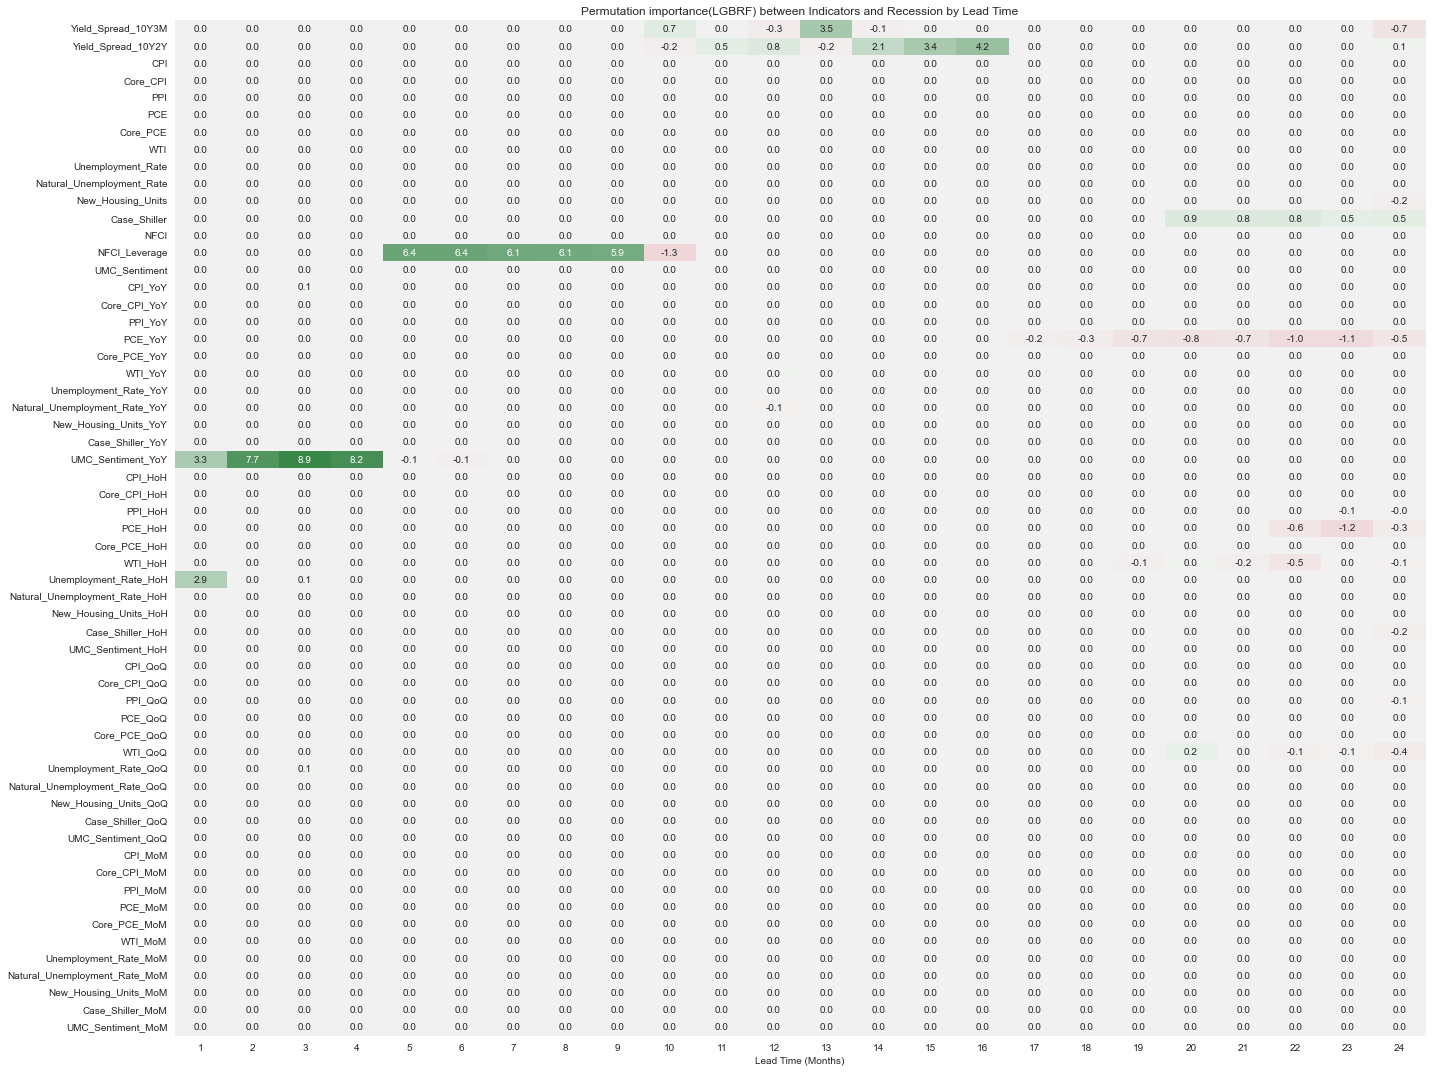
lightgbm 패키지에서 제공하는 랜덤포레스트 모델(이 글에서는 LGBRF로 표기)도 NFCI_Leverage와 UMC_Sentiment_YoY 변수의 중요도가 높게 나타났는데, XGBRF에서 두 변수 모두 단기예측에서 중요도가 높았던 것과는 달리 LGBRF에서 UMC_Sentiment_YoY는 1~4개월 후의 경기침체 여부를 예측, NFCI_Leverage는 6~9개월 후의 경기침체 여부를 예측할 때 높게 나타났다. 12개월~16개월 정도 이후에 대한 예측에는 장단기 금리차 변수의 중요도가 상대적으로 높게 나타났다.
df_auc_LGBRF = pd.DataFrame(pd.concat([pd.Series([i+1 for i in range(24)], name='Lead Time'),
                            pd.Series(auc_LGBRF, name='AUC')], axis=1))
df_auc_LGBRF.set_index('Lead Time').sort_index(ascending=False).plot.barh(
    figsize=(10, 10),
    title='Averaged AUC(LGBRF) by Lead Time',
    ylabel='AUC',
    xlabel='Lead Time'
    );
5.3.4. XGB
from sklearn.inspection import permutation_importance
from sklearn.model_selection import TimeSeriesSplit
from xgboost import XGBClassifier

permute_imp_XGB = []
auc_XGB = []

months = list(range(1, 25))
for month in months:
    df_ = data_resampled.copy()
    df_[label] = df_[label].shift(-month)
    df_ = df_.dropna()
    permute_imp_ = []
    auc_ = []

    tscv = TimeSeriesSplit(n_splits=3)
    for train_idx, valid_idx in tscv.split(df_.loc[:, features]):

        X_train = df_.iloc[train_idx, :][features]
        y_train = df_.iloc[train_idx, :][label]
        X_valid = df_.iloc[valid_idx, :][features]
        y_valid = df_.iloc[valid_idx, :][label]
        model = XGBClassifier(random_state=42)
        model.fit(X=X_train, y=y_train, eval_metric='auc')
        y_pred = model.predict_proba(X_valid)[:, 1]

        p_imp = permutation_importance(model, X_valid, y_valid,
                                       n_repeats=10,
                                       random_state=0)
        permute_imp_.append(p_imp['importances_mean'])
        auc_.append(roc_auc_score(y_valid, y_pred))
    permute_imp_XGB.append(np.mean(permute_imp_, axis=0))
    auc_XGB.append(np.mean(auc_, axis=0))
permute_imp_XGB = pd.DataFrame(permute_imp_XGB, columns=model.get_booster().feature_names, index=months)

fig, ax = plt.subplots(figsize=(20, 15))
cmap = sns.diverging_palette(10, 133, as_cmap=True)
sns.heatmap(permute_imp_XGB.T*100, cmap=cmap, center=0, ax=ax, annot=True, fmt='.1f', cbar=False)
ax.set_xlabel('Lead Time (Months)')
ax.set_title('Permutation importance(XGB) between Indicators and Recession by Lead Time')
fig.tight_layout();
df_auc_XGB = pd.DataFrame(pd.concat([pd.Series([i+1 for i in range(24)], name='Lead Time'),
                          pd.Series(auc_XGB, name='AUC')], axis=1))
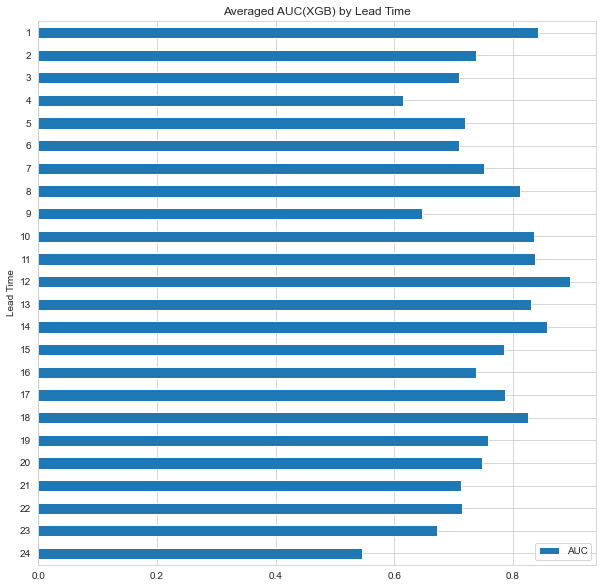
df_auc_XGB.set_index('Lead Time').sort_index(ascending=False).plot.barh(
    figsize=(10, 10),
    title='Averaged AUC(XGB) by Lead Time',
    ylabel='AUC',
    xlabel='Lead Time'
    );
5.3.5. LGB
from re import A
from sklearn.inspection import permutation_importance
from sklearn.model_selection import TimeSeriesSplit
from lightgbm import LGBMClassifier

permute_imp_LGB = []
auc_LGB = []

months = list(range(1, 25))
for month in months:
    df_ = data_resampled.copy()
    df_[label] = df_[label].shift(-month)
    df_ = df_.dropna()
    permute_imp_ = []
    auc_ = []

    tscv = TimeSeriesSplit(n_splits=3)
    for train_idx, valid_idx in tscv.split(df_.loc[:, features]):

        X_train = df_.iloc[train_idx, :][features]
        y_train = df_.iloc[train_idx, :][label]
        X_valid = df_.iloc[valid_idx, :][features]
        y_valid = df_.iloc[valid_idx, :][label]
        model = LGBMClassifier(random_state=42)
        model.fit(X=X_train, y=y_train, eval_metric='auc')
        y_pred = model.predict_proba(X_valid)[:, 1]

        p_imp = permutation_importance(model, X_valid, y_valid,
                                       n_repeats=10,
                                       random_state=0)
        permute_imp_.append(p_imp['importances_mean'])
        auc_.append(roc_auc_score(y_valid, y_pred))

    permute_imp_LGB.append(np.mean(permute_imp_, axis=0))
    auc_LGB.append(np.mean(auc_, axis=0))
permute_imp_LGB = pd.DataFrame(permute_imp_LGB, columns=model.booster_.feature_name(), index=months)

fig, ax = plt.subplots(figsize=(20, 15))
cmap = sns.diverging_palette(10, 133, as_cmap=True)
sns.heatmap(permute_imp_LGB.T*100, cmap=cmap, center=0, ax=ax, annot=True, fmt='.1f', cbar=False)
ax.set_xlabel('Lead Time (Months)')
ax.set_title('Permutation importance(LGB) between Indicators and Recession by Lead Time')
fig.tight_layout();
df_auc_LGB = pd.DataFrame(pd.concat([pd.Series([i+1 for i in range(24)], name='Lead Time'),
                      pd.Series(auc_LGB, name='AUC')], axis=1))
df_auc_LGB.set_index('Lead Time').sort_index(ascending=False).plot.barh(
    figsize=(10, 10),
    title='Averaged AUC(LGB) by Lead Time',
    ylabel='AUC',
    xlabel='Lead Time'
    );
AUC 그래프를 한 번에 모아서 비교해보자.

Random Forest 모형들은 12개월 이내의 경기침체를 예측할 때 성능이 상대적으로 좋았고, XGB와 LGB는 18개월 이후의 경기침체를 예측할 때 성능이 상대적으로 좋았다. 전반적으로 12개월 근처의 경기침체를 예측할 때 성능이 좋게 나타나는 것을 볼 수 있다.
6. 타겟변수 재정의 & 변수간 상관관계 파악
6.1. 타겟변수 재정의
permutation importance를 보면 너무 먼 시점의 경기침체 여부를 예측하기보다는 6개월 혹은 1년 이내의 경기침체 여부를 예측해보는 것이 더 나을 것 같다는 생각이 든다. 또한, 보통 경기침체 확률을 예측할 때 1년 이내에 경기침체가 올 확률을 예측하는 것 같기도 해서 타겟변수를 현재 시점에서 1년 이내의 경기침체 여부로 재정의하였다.
def within_n_month_target(df, label, n):
    df = df.assign(
        target = df[label].shift(1).rolling(n).max().shift(-1).shift(-n).fillna(0)
    )
    return df

data_resampled = within_n_month_target(data_resampled, label, 12)

print(f'# of 1s in original target: {data_resampled[label].sum()}, # of 1s in new target: {data_resampled.target.sum()}')
# of 1s in original target: 36.0, # of 1s in new target: 80.0

# 새로 정의한 target(현재 시점 이후 1년내 경기침체가 발생하면 1 아니면 0)
label_new = 'target'
타겟변수를 새로 정의한 후에 변수들 사이의 상관관계를 살펴보았다.
6.2. Correlation between original variables
import seaborn as sns
import matplotlib.pyplot as plt

corr = data_resampled.loc[:,features_org+[label_new]].corr()*100
# ut = np.triu(corr)
cmap = sns.diverging_palette(10, 133, as_cmap=True)
fig, ax = plt.subplots(figsize=(12,12))    # figsize
ax = sns.heatmap(corr,
                #  mask=ut,
                 cmap=cmap,           # cmap Color
                 annot=True,            # Value Text
                 fmt=".1f",             # Value type (interge = "d")
                 linewidths=2)
ax.set_title(label=f'Correlation between original variables and target');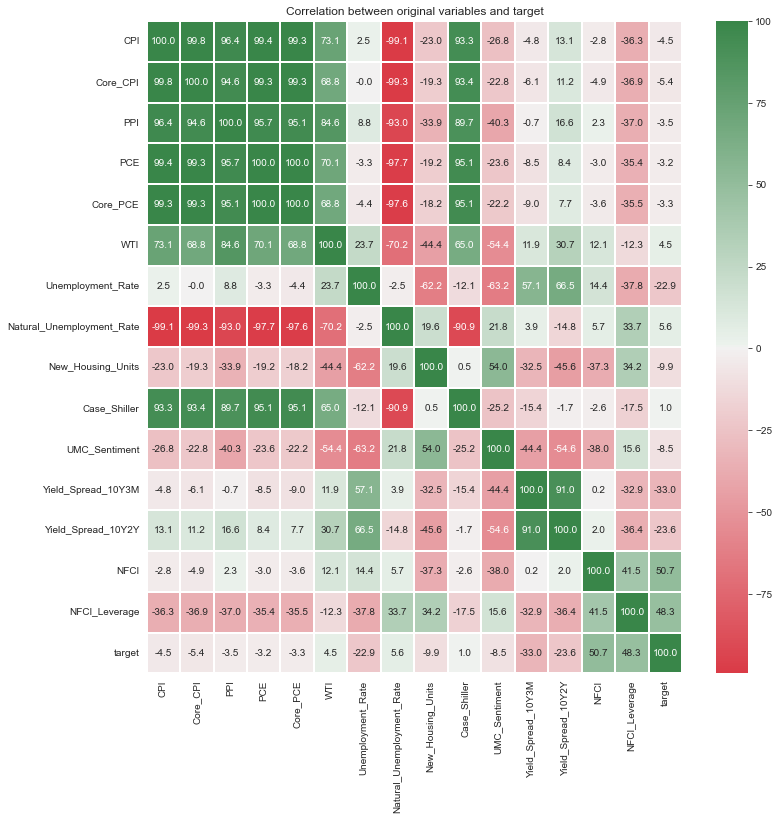
Case-Shiller 주택가격지수와 WTI는 CPI, PPI, PCE등 다른 물가관련 지표들과 상관관계가 높게 나타난다. 또한, 장단기금리차 지표의 경우에는 실업률 지표와 어느 정도 상관성이 있어 보이고, 12개월 이내의 경기침체 여부를 예측할 때에는 permutation importance가 특별히 좋게 나타나지는 않았다. 앞에서 언급했듯이 이번 경기침체 양상을 1970년대와 비슷하게 보는 의견이 많기 때문에 장단기금리차, Case-Shiller 주택가격지수, WTI를 제외하고 1970년대 데이터를 train set에 포함시키는 것이 좋아 보인다.
6.3. Correlation between YoY variables
import seaborn as sns
import matplotlib.pyplot as plt

corr = data_resampled.loc[:,features_YoY+[label_new]].corr()*100
# ut = np.triu(corr)
cmap = sns.diverging_palette(10, 133, as_cmap=True)
fig, ax = plt.subplots(figsize=(12,12))    # figsize
ax = sns.heatmap(corr,
                #  mask=ut,
                 cmap=cmap,           # cmap Color
                 annot=True,            # Value Text
                 fmt=".1f",             # Value type (interge = "d")
                 linewidths=2)
ax.set_title(label=f'Correlation between YoY variables and target');
YoY 변수 간의 상관관계를 보면 Unemplayment_Rate 변수와 CPI, PPI, PCE 등 물가관련 지표들이 상관관계가 원변수에서의 관계와는 다른 양상으로 나타나는 모습을 볼 수 있다. 원 변수에서는 물가관련 지표와의 상관성이 크지 않았지만 전년동기대비로 증감률을 계산해 보았을 때는 음의 상관관계가 나타난다. 물가지표는 크게 상승하고 실업률은 감소한 최근의 경향성을 나타낸다고 볼 수 있을 것 같다.
6.4. Correlation between HoH variables
import seaborn as sns
import matplotlib.pyplot as plt

corr = data_resampled.loc[:,features_HoH+[label_new]].corr()*100
# ut = np.triu(corr)
cmap = sns.diverging_palette(10, 133, as_cmap=True)
fig, ax = plt.subplots(figsize=(12,12))    # figsize
ax = sns.heatmap(corr,
                #  mask=ut,
                 cmap=cmap,           # cmap Color
                 annot=True,            # Value Text
                 fmt=".1f",             # Value type (interge = "d")
                 center=0.00,
                 linewidths=2)
ax.set_title(label=f'Correlation between HoH variables and target');
6.5. Correlation between QoQ variables
import seaborn as sns
import matplotlib.pyplot as plt

corr = data_resampled.loc[:,features_QoQ+[label_new]].corr()*100
# ut = np.triu(corr)
cmap = sns.diverging_palette(10, 133, as_cmap=True)
fig, ax = plt.subplots(figsize=(12,12))    # figsize
ax = sns.heatmap(corr,
                #  mask=ut,
                 cmap=cmap,           # cmap Color
                 annot=True,            # Value Text
                 fmt=".1f",             # Value type (interge = "d")
                 center=0.00,
                 linewidths=2)
ax.set_title(label=f'Correlation between QoQ variables and target');
6.6. Correlation between MoM variables
import seaborn as sns
import matplotlib.pyplot as plt

corr = data_resampled.loc[:,features_MoM+[label_new]].corr()*100
# ut = np.triu(corr)
cmap = sns.diverging_palette(10, 133, as_cmap=True)
fig, ax = plt.subplots(figsize=(12,12))    # figsize
ax = sns.heatmap(corr,
                #  mask=ut,
                 cmap=cmap,           # cmap Color
                 annot=True,            # Value Text
                 fmt=".1f",             # Value type (interge = "d")
                 center=0.00,
                 linewidths=2)
ax.set_title(label=f'Correlation between MoM variables and target');
HoH, QoQ, MoM 변수들 사이의 상관관계보다는 YoY 변수들 사이의 상관관계가 양의 방향으로 든 음의 방향으로 든 더 강하게 나타나는 경향성이 있는 것 같다.
7. 새로운 타겟변수로 모델 학습
이제 장단기금리차, Case-Shiller 주택가격 지수, WTI 변수를 제외한 후 모델을 학습시키고 time series CV를 통해 permutation importance와 AUC 값을 확인해보자.
# 전처리 작업 다시 수행
data_resampled = data.drop(columns=['Recession_GDP', 'Yield_Spread_10Y3M', 'Yield_Spread_10Y2Y', 'Case_Shiller', 'WTI']).ffill().resample('M').last()

data_resampled = data_resampled.assign(

    CPI_YoY=data_resampled.CPI.pct_change(12),
    Core_CPI_YoY=data_resampled.Core_CPI.pct_change(12),
    PPI_YoY=data_resampled.PPI.pct_change(12),
    PCE_YoY=data_resampled.PCE.pct_change(12),
    Core_PCE_YoY=data_resampled.Core_PCE.pct_change(12),
    Unemployment_Rate_YoY=data_resampled.Unemployment_Rate.pct_change(12),
    Natural_Unemployment_Rate_YoY=data_resampled.Natural_Unemployment_Rate.pct_change(12),
    New_Housing_Units_YoY=data_resampled.New_Housing_Units.pct_change(12),
    UMC_Sentiment_YoY=data_resampled.UMC_Sentiment.pct_change(12),

    CPI_HoH=data_resampled.CPI.pct_change(6),
    Core_CPI_HoH=data_resampled.Core_CPI.pct_change(6),
    PPI_HoH=data_resampled.PPI.pct_change(6),
    PCE_HoH=data_resampled.PCE.pct_change(6),
    Core_PCE_HoH=data_resampled.Core_PCE.pct_change(6),
    Unemployment_Rate_HoH=data_resampled.Unemployment_Rate.pct_change(6),
    Natural_Unemployment_Rate_HoH=data_resampled.Natural_Unemployment_Rate.pct_change(6),
    New_Housing_Units_HoH=data_resampled.New_Housing_Units.pct_change(6),
    UMC_Sentiment_HoH=data_resampled.UMC_Sentiment.pct_change(6),

    CPI_QoQ=data_resampled.CPI.pct_change(3),
    Core_CPI_QoQ=data_resampled.Core_CPI.pct_change(3),
    PPI_QoQ=data_resampled.PPI.pct_change(3),
    PCE_QoQ=data_resampled.PCE.pct_change(3),
    Core_PCE_QoQ=data_resampled.Core_PCE.pct_change(3),
    Unemployment_Rate_QoQ=data_resampled.Unemployment_Rate.pct_change(3),
    Natural_Unemployment_Rate_QoQ=data_resampled.Natural_Unemployment_Rate.pct_change(3),
    New_Housing_Units_QoQ=data_resampled.New_Housing_Units.pct_change(3),
    UMC_Sentiment_QoQ=data_resampled.UMC_Sentiment.pct_change(3),

    CPI_MoM=data_resampled.CPI.pct_change(1),
    Core_CPI_MoM=data_resampled.Core_CPI.pct_change(1),
    PPI_MoM=data_resampled.PPI.pct_change(1),
    PCE_MoM=data_resampled.PCE.pct_change(1),
    Core_PCE_MoM=data_resampled.Core_PCE.pct_change(1),
    Unemployment_Rate_MoM=data_resampled.Unemployment_Rate.pct_change(1),
    Natural_Unemployment_Rate_MoM=data_resampled.Natural_Unemployment_Rate.pct_change(1),
    New_Housing_Units_MoM=data_resampled.New_Housing_Units.pct_change(1),
    UMC_Sentiment_MoM=data_resampled.UMC_Sentiment.pct_change(1)
                                       )

data_resampled = data_resampled.dropna()

def within_n_month_target(df, label, n):
    df = df.assign(
        target = df[label].shift(1).rolling(n).max().shift(-1).shift(-n).fillna(0)
    )
    return df

data_resampled = within_n_month_target(data_resampled, label, 12)

label = 'Recession_NBER'
label_new = 'target'
features = [col for col in data_resampled.columns if col not in [label, label_new]]

data_resampled.info()

<class 'pandas.core.frame.DataFrame'>
DatetimeIndex: 618 entries, 1971-01-31 to 2022-06-30
Freq: M
Data columns (total 48 columns):
 #   Column                         Non-Null Count  Dtype
---  ------                         --------------  -----
 0   Recession_NBER                 618 non-null    float64
 1   CPI                            618 non-null    float64
 2   Core_CPI                       618 non-null    float64
 3   PPI                            618 non-null    float64
 4   PCE                            618 non-null    float64
 5   Core_PCE                       618 non-null    float64
 6   Unemployment_Rate              618 non-null    float64
 7   Natural_Unemployment_Rate      618 non-null    float64
 8   New_Housing_Units              618 non-null    float64
 9   NFCI                           618 non-null    float64
 10  NFCI_Leverage                  618 non-null    float64
 11  UMC_Sentiment                  618 non-null    float64
 12  CPI_YoY                        618 non-null    float64
 13  Core_CPI_YoY                   618 non-null    float64
 14  PPI_YoY                        618 non-null    float64
 15  PCE_YoY                        618 non-null    float64
 16  Core_PCE_YoY                   618 non-null    float64
 17  Unemployment_Rate_YoY          618 non-null    float64
 18  Natural_Unemployment_Rate_YoY  618 non-null    float64
...
 46  New_Housing_Units_MoM          618 non-null    float64
 47  UMC_Sentiment_MoM              618 non-null    float64
dtypes: float64(48)
memory usage: 236.6 KB
모델링 코드는 위에서 사용한 것과 동일하므로 생략하고 Lead Time에 따른 모형별 AUC값을 비교한 그래프만 첨부한다.
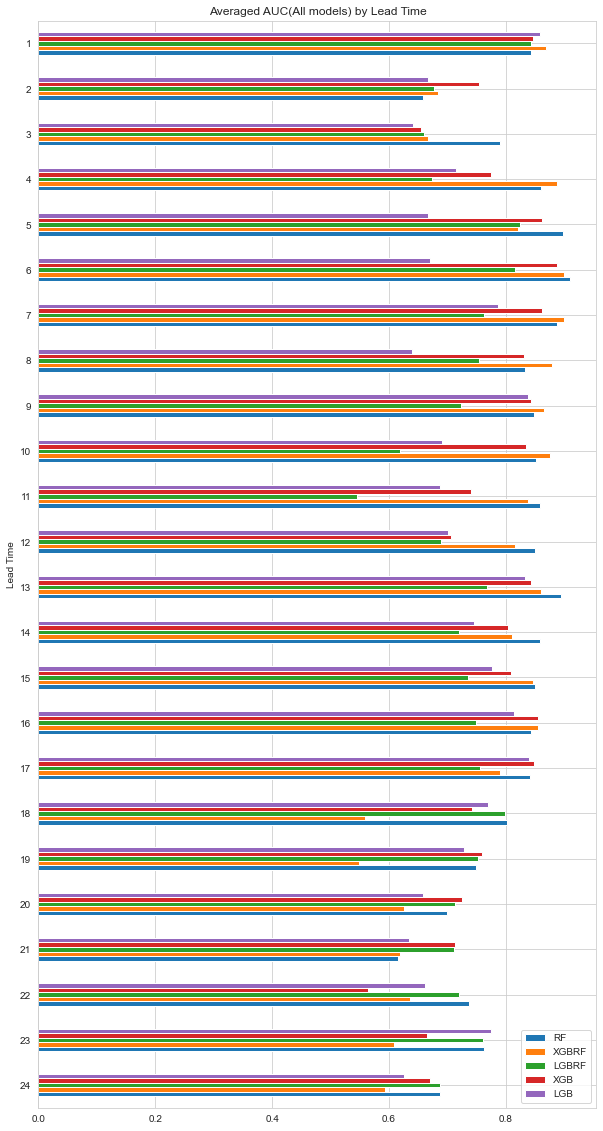
다음으로 12개월 이내 경기침체 여부를 타겟변수로 하여 모델을 학습시켰다.
#### Random Forest
from sklearn.ensemble import RandomForestClassifier
from sklearn.inspection import permutation_importance
from sklearn.model_selection import TimeSeriesSplit
from sklearn.metrics import roc_auc_score

permute_imp_ = []
auc_ = []
tscv = TimeSeriesSplit(n_splits=3)
for train_idx, valid_idx in tscv.split(df_.loc[:, features]):

    X_train = df_.iloc[train_idx, :][features]
    y_train = df_.iloc[train_idx, :][label_new]
    X_valid = df_.iloc[valid_idx, :][features]
    y_valid = df_.iloc[valid_idx, :][label_new]
    model = RandomForestClassifier(random_state=42)
    model.fit(X=X_train, y=y_train)
    y_pred = model.predict_proba(X_valid)[:, 1]
    p_imp = permutation_importance(model, X_valid, y_valid,
                                    n_repeats=10,
                                    random_state=0)
    permute_imp_.append(p_imp['importances_mean'])
    auc_.append(roc_auc_score(y_valid, y_pred))

permute_imp_rf = np.mean(permute_imp_, axis=0)
auc_rf = np.mean(auc_, axis=0)
df_permute_imp_rf = pd.DataFrame({'features':model.feature_names_in_, 'RF': permute_imp_rf})

#### XGBRF
from xgboost import XGBRFClassifier
from sklearn.inspection import permutation_importance
from sklearn.model_selection import TimeSeriesSplit
from sklearn.metrics import roc_auc_score

permute_imp_ = []
auc_ = []
tscv = TimeSeriesSplit(n_splits=3)
for train_idx, valid_idx in tscv.split(df_.loc[:, features]):

    X_train = df_.iloc[train_idx, :][features]
    y_train = df_.iloc[train_idx, :][label_new]
    X_valid = df_.iloc[valid_idx, :][features]
    y_valid = df_.iloc[valid_idx, :][label_new]
    model = XGBRFClassifier(random_state=42)
    model.fit(X=X_train, y=y_train, eval_metric='auc')
    y_pred = model.predict_proba(X_valid)[:, 1]
    p_imp = permutation_importance(model, X_valid, y_valid,
                                    n_repeats=10,
                                    random_state=0)
    permute_imp_.append(p_imp['importances_mean'])
    auc_.append(roc_auc_score(y_valid, y_pred))

permute_imp_XGBRF = np.mean(permute_imp_, axis=0)
auc_XGBRF = np.mean(auc_, axis=0)
df_permute_imp_XGBRF = pd.DataFrame({'features':model.get_booster().feature_names, 'XGBRF': permute_imp_XGBRF})

#### LGBRF
from sklearn.inspection import permutation_importance
from sklearn.model_selection import TimeSeriesSplit
from lightgbm import LGBMClassifier


permute_imp_ = []
auc_ = []

tscv = TimeSeriesSplit(n_splits=3)
for train_idx, valid_idx in tscv.split(df_.loc[:, features]):

    X_train = df_.iloc[train_idx, :][features]
    y_train = df_.iloc[train_idx, :][label_new]
    X_valid = df_.iloc[valid_idx, :][features]
    y_valid = df_.iloc[valid_idx, :][label_new]
    model = LGBMClassifier(boosting_type='rf',
                            bagging_freq=1,
                            bagging_fraction=0.8,
                            random_state=42)
    model.fit(X=X_train, y=y_train, eval_metric='auc')
    y_pred = model.predict_proba(X_valid)[:, 1]

    p_imp = permutation_importance(model, X_valid, y_valid,
                                    n_repeats=10,
                                    random_state=0)
    permute_imp_.append(p_imp['importances_mean'])
    auc_.append(roc_auc_score(y_valid, y_pred))
permute_imp_LGBRF = np.mean(permute_imp_, axis=0)
auc_LGBRF = np.mean(auc_, axis=0)
df_permute_imp_LGBRF = pd.DataFrame({'features':model.booster_.feature_name(), 'LGBRF': permute_imp_LGBRF})

#### XGB
from sklearn.inspection import permutation_importance
from sklearn.model_selection import TimeSeriesSplit
from xgboost import XGBClassifier

permute_imp_ = []
auc_ = []

tscv = TimeSeriesSplit(n_splits=3)
for train_idx, valid_idx in tscv.split(df_.loc[:, features]):

    X_train = df_.iloc[train_idx, :][features]
    y_train = df_.iloc[train_idx, :][label_new]
    X_valid = df_.iloc[valid_idx, :][features]
    y_valid = df_.iloc[valid_idx, :][label_new]
    model = XGBClassifier(random_state=42)
    model.fit(X=X_train, y=y_train, eval_metric='auc')
    y_pred = model.predict_proba(X_valid)[:, 1]

    p_imp = permutation_importance(model, X_valid, y_valid,
                                    n_repeats=10,
                                    random_state=0)
    permute_imp_.append(p_imp['importances_mean'])
    auc_.append(roc_auc_score(y_valid, y_pred))
permute_imp_XGB = np.mean(permute_imp_, axis=0)
auc_XGB = np.mean(auc_, axis=0)
df_permute_imp_XGB = pd.DataFrame({'features':model.get_booster().feature_names, 'XGB': permute_imp_XGB})

#### LGB
from sklearn.inspection import permutation_importance
from sklearn.model_selection import TimeSeriesSplit
from lightgbm import LGBMClassifier

permute_imp_ = []
auc_ = []

tscv = TimeSeriesSplit(n_splits=3)
for train_idx, valid_idx in tscv.split(df_.loc[:, features]):

    X_train = df_.iloc[train_idx, :][features]
    y_train = df_.iloc[train_idx, :][label]
    X_valid = df_.iloc[valid_idx, :][features]
    y_valid = df_.iloc[valid_idx, :][label]
    model = LGBMClassifier(random_state=42)
    model.fit(X=X_train, y=y_train, eval_metric='auc')
    y_pred = model.predict_proba(X_valid)[:, 1]

    p_imp = permutation_importance(model, X_valid, y_valid,
                                    n_repeats=10,
                                    random_state=0)
    permute_imp_.append(p_imp['importances_mean'])
    auc_.append(roc_auc_score(y_valid, y_pred))

permute_imp_LGB = np.mean(permute_imp_, axis=0)
auc_LGB = np.mean(auc_, axis=0)
df_permute_imp_LGB = pd.DataFrame({'features':model.booster_.feature_name(), 'LGB': permute_imp_LGB})

df_permute_imp = pd.concat([
    df_permute_imp_rf.set_index('features'),
    df_permute_imp_XGBRF.set_index('features'),
    df_permute_imp_LGBRF.set_index('features'),
    df_permute_imp_XGB.set_index('features'),
    df_permute_imp_LGB.set_index('features')
    ]
    ,axis=1
    )

fig, ax = plt.subplots(figsize=(10, 10))
cmap = sns.diverging_palette(10, 133, as_cmap=True)
sns.heatmap(df_permute_imp*100, cmap=cmap, center=0, ax=ax, annot=True, fmt='.1f', cbar=False)
ax.set_xlabel('Model')
ax.set_title('Permutation importance between Indicators and Recession')
fig.tight_layout();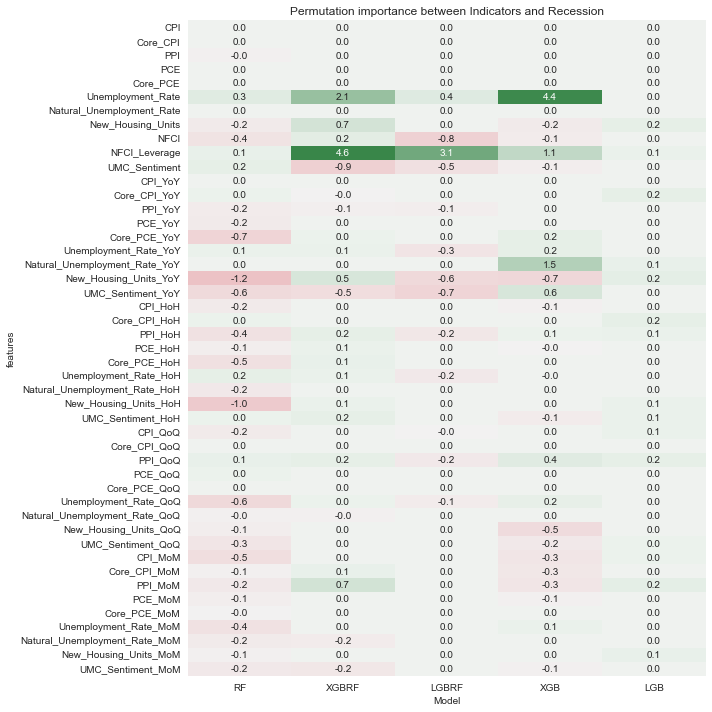
XGBRF와 XGB 모형에서 Unemployment_Rate와 NFCI_Leverage 항목의 중요도가 상대적으로 높게 나타났다. RF와LGBRF는 permutation importance가 음수 값으로 나온 항목들이 많고, LGB는 대부분 0에 가까운 값으로 나온 것으로 보아 다른 모형에 비해 학습이 잘 되지 않았을 것으로 예상해볼 수 있다.
print(f'AUC(RF): {round(auc_rf, 4)}, AUC(XGBRF): {round(auc_XGBRF, 4)}, AUC(LGBRF):{round(auc_LGBRF, 4)}, AUC(XGB): {round(auc_XGB, 4)}, AUC(LGB): {round(auc_LGB, 4)}')

AUC(RF): 0.9141, AUC(XGBRF): 0.9319, AUC(LGBRF):0.902, AUC(XGB): 0.9378, AUC(LGB): 0.6248
AUC 값을 비교해보면 예상했던 것처럼 RF, LGBRF, LGB의 예측성능이 XGBRF, XGB보다 떨어지는 것을 볼 수 있다. XGB 모형의 경우 permutation importance가 음수인 항목들이 꽤 존재하지만 중요도가 뚜렷하게 나타나는 몇몇 변수들의 영향으로 예측성능이 좋게 나타난 것이 아닌가 추정해볼 수 있다.
8. 향후 12개월 이내 경기침체 확률 예측하기
마지막으로 CV에서 AUC 값이 가장 높게 나온 XGB를 최종 모형으로 하고 2021년 6월 데이터까지 train data로 하여 모형을 학습시키고, 이후 시점(2021.07~2022.06)에 대해 향후 12개월 이내에 경기침체가 올 확률을 예측해보았다.
X_train = data_resampled[:'2021-06-30'][features]
y_train = data_resampled[:'2021-06-30'][label_new]
X_test = data_resampled['2021-07-31':][features]

model = XGBClassifier(random_state=42)
model.fit(X=X_train, y=y_train, eval_metric='auc')

pred = pd.DataFrame({'Date': X_test.index.strftime('%Y%m'), 'Recession prob.': model.predict_proba(X_test)[:,1]})
import plotly.express as px
fig = px.line(pred, x='Date', y='Recession prob.')
fig.update_layout(title='Recession prob. within 12 months', title_x=0.5)
최근 시점에 가까워질 수록 향후 12개월 이내에 경기침체가 올 확률이 높아지는 것을 볼 수 있다. 2022년 6월 말 기준으로 보았을 때 약 27.69%로 나타났다. 월스트리트 전문가들의 의견이 30%~40% 정도 수준으로 나타나는 것으로 보아 모형의 예측값이 조금 더 보수적으로 나타난다고 할 수도 있을 것 같다.
[NY 인사이트] 골드만삭스, 美 경기침체 확률 30%로 상향
골드만삭스가 21일(현지시간) 미국 경기침체 확률을 상향조정했다. 미 국내총생산(GDP) 성장률 전망치는 낮춰 잡았다.모건스탠리는 미국이 경기침체에 빠질 경우 뉴욕 주식시장 수익률 지표인 스
news.g-enews.com
美 경제학자들 "1년내 경기침체 확률 44%…2008년보다 더 걱정"
美 경제학자들 "1년내 경기침체 확률 44%…2008년보다 더 걱정", 월스트리트저널 설문조사
www.hankyung.com
9. 글을 마치며
이번 글에서는 지난 글에서 살펴본 경기침체 예측을 위한 여러 지표들을 활용하여 향후 12개월 이내의 경기침체 확률을 예측하는 모형을 만들어 보았다. 대부분의 경제지표가 월단위나 분기단위로 발표되기 때문에 확보할 수 있는 데이터포인트의 수가 적고, 경기침체는 어쩌다 한번 일어나는 희귀한 사건이기 때문에 모형 학습이 제대로 되지 않았을 수도 있다. 또한, 모형 비교 과정에서 모형의 하이퍼파라미터에 대한 튜닝은 하지 않고 대부분 디폴트 옵션을 사용하여 모델링을 진행하였기 때문에 하이퍼파라미터 튜닝이 이루어지면 이 글에 작성된 결과와는 다른 결과가 나올 수도 있다. 일단 생각나는 대로 의식의 흐름대로 모델링을 진행했기 때문에 논리적으로 부족한 부분들이 왕왕 있을 것 같지만, 나중에 다시 보는 것으로 하고 이 글은 이정도 선에서 마치고자 한다. 끝.