

[출처] https://docs.streamlit.io/get-started/tutorials/create-a-multipage-app
추가 기능에서는 페이지를 정의하고, 멀티페이지 앱을 구성 및 실행하고, 사용자 인터페이스에서 페이지 간을 탐색하는 방법을 포함하여 멀티페이지 앱을 소개했습니다. 자세한 내용은 멀티페이지 앱 가이드에서 확인할 수 있습니다. 이 가이드에서는 이전 버전의 streamlit hello 앱을 멀티페이지 앱으로 변환하여 멀티페이지 앱에 대한 이해를 활용해 보겠습니다!
1. Motivation
Streamlit 1.10.0 이전에는 streamlit hello 명령이 큰 단일 페이지 앱이었습니다. 여러 페이지를 지원하지 않았기 때문에 사이드바의 st.selectbox를 사용하여 앱의 콘텐츠를 분할하여 실행할 콘텐츠를 선택해야 했습니다. 콘텐츠는 플로팅, 매핑 및 데이터프레임에 대한 세 가지 데모로 구성됩니다.
코드와 단일 페이지 앱의 모습은 다음과 같습니다:
import streamlit as st
def intro():
import streamlit as st
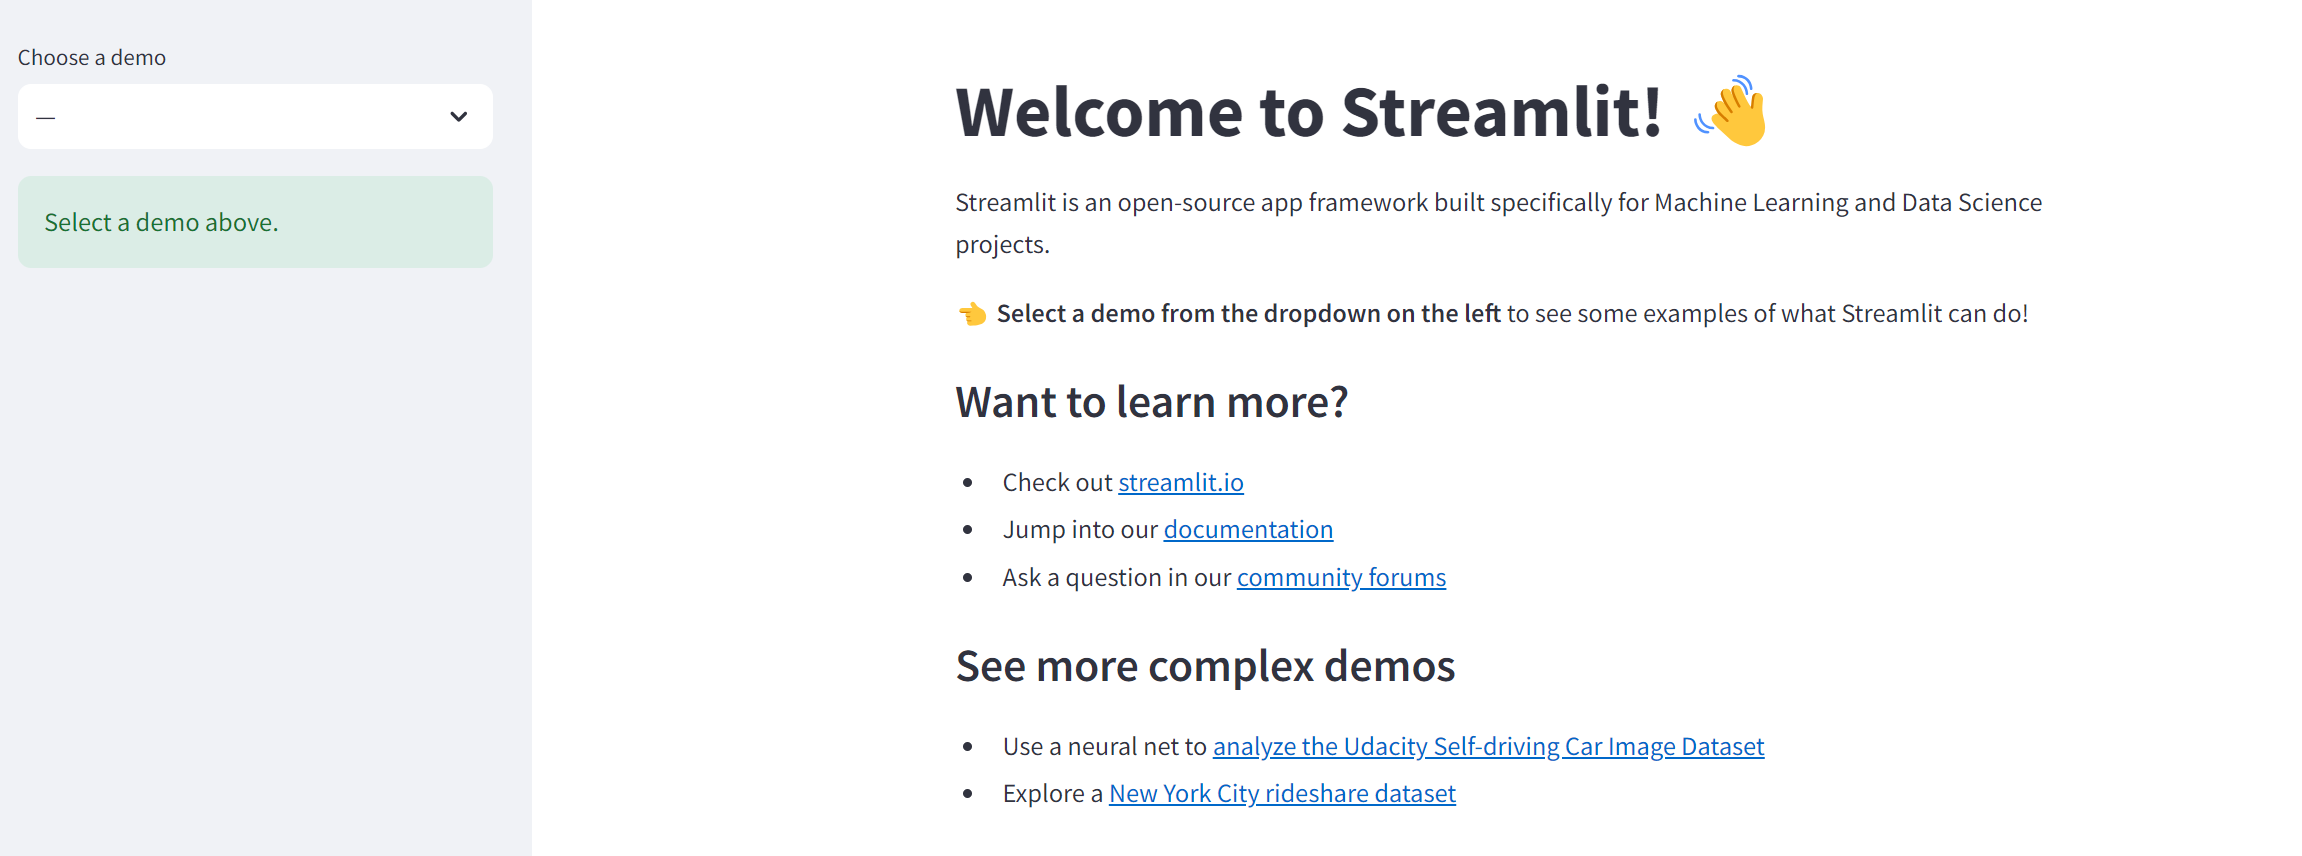
st.write("# Welcome to Streamlit! 👋")
st.sidebar.success("Select a demo above.")
st.markdown(
"""
Streamlit is an open-source app framework built specifically for
Machine Learning and Data Science projects.
**👈 Select a demo from the dropdown on the left** to see some examples
of what Streamlit can do!
### Want to learn more?
- Check out [streamlit.io](https://streamlit.io)
- Jump into our [documentation](https://docs.streamlit.io)
- Ask a question in our [community
forums](https://discuss.streamlit.io)
### See more complex demos
- Use a neural net to [analyze the Udacity Self-driving Car Image
Dataset](https://github.com/streamlit/demo-self-driving)
- Explore a [New York City rideshare dataset](https://github.com/streamlit/demo-uber-nyc-pickups)
"""
)
def mapping_demo():
import streamlit as st
import pandas as pd
import pydeck as pdk
from urllib.error import URLError
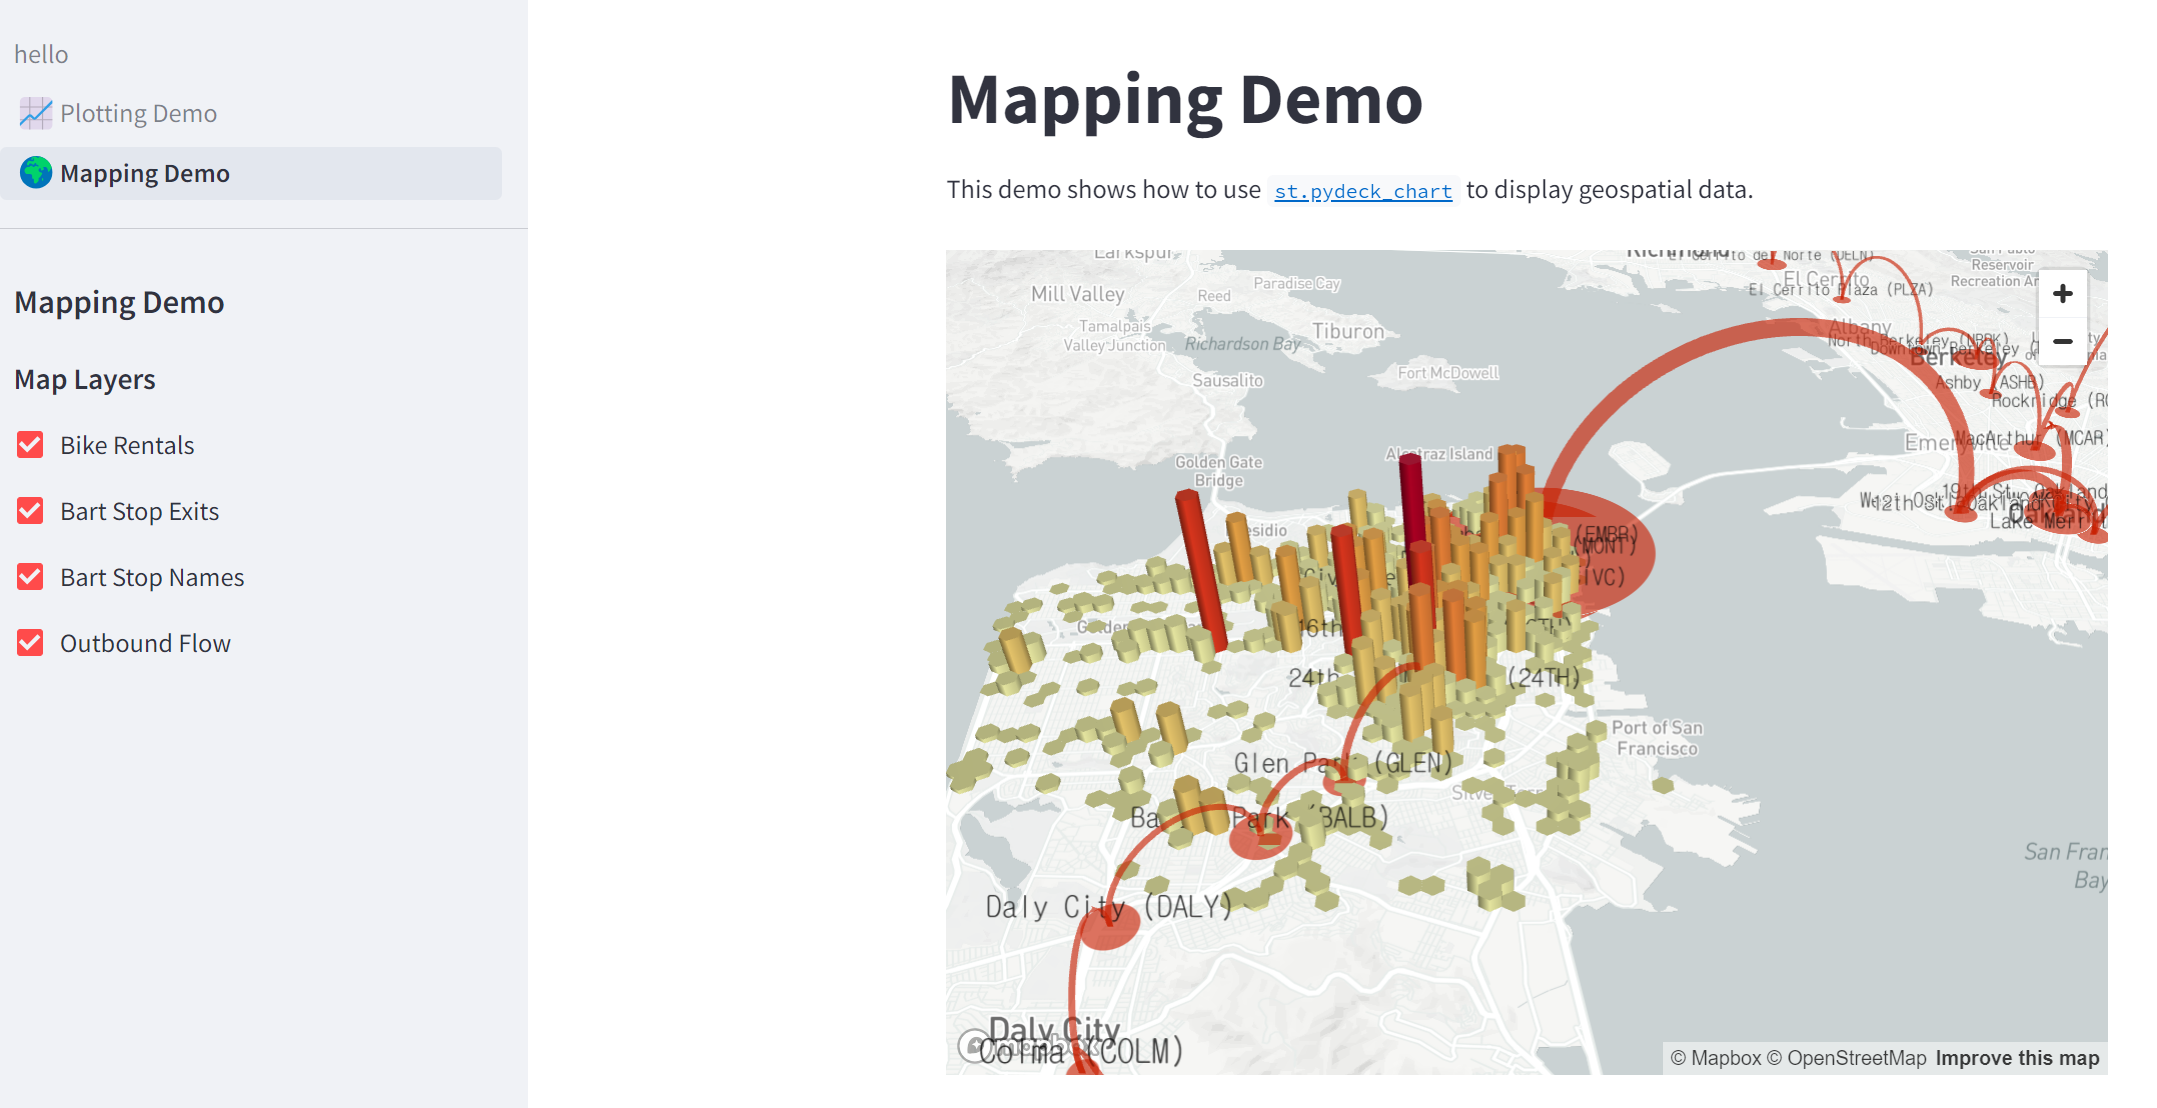
st.markdown(f"# {list(page_names_to_funcs.keys())[2]}")
st.write(
"""
This demo shows how to use
[`st.pydeck_chart`](https://docs.streamlit.io/develop/api-reference/charts/st.pydeck_chart)
to display geospatial data.
"""
)
@st.cache_data
def from_data_file(filename):
url = (
"http://raw.githubusercontent.com/streamlit/"
"example-data/master/hello/v1/%s" % filename
)
return pd.read_json(url)
try:
ALL_LAYERS = {
"Bike Rentals": pdk.Layer(
"HexagonLayer",
data=from_data_file("bike_rental_stats.json"),
get_position=["lon", "lat"],
radius=200,
elevation_scale=4,
elevation_range=[0, 1000],
extruded=True,
),
"Bart Stop Exits": pdk.Layer(
"ScatterplotLayer",
data=from_data_file("bart_stop_stats.json"),
get_position=["lon", "lat"],
get_color=[200, 30, 0, 160],
get_radius="[exits]",
radius_scale=0.05,
),
"Bart Stop Names": pdk.Layer(
"TextLayer",
data=from_data_file("bart_stop_stats.json"),
get_position=["lon", "lat"],
get_text="name",
get_color=[0, 0, 0, 200],
get_size=15,
get_alignment_baseline="'bottom'",
),
"Outbound Flow": pdk.Layer(
"ArcLayer",
data=from_data_file("bart_path_stats.json"),
get_source_position=["lon", "lat"],
get_target_position=["lon2", "lat2"],
get_source_color=[200, 30, 0, 160],
get_target_color=[200, 30, 0, 160],
auto_highlight=True,
width_scale=0.0001,
get_width="outbound",
width_min_pixels=3,
width_max_pixels=30,
),
}
st.sidebar.markdown("### Map Layers")
selected_layers = [
layer
for layer_name, layer in ALL_LAYERS.items()
if st.sidebar.checkbox(layer_name, True)
]
if selected_layers:
st.pydeck_chart(
pdk.Deck(
map_style="mapbox://styles/mapbox/light-v9",
initial_view_state={
"latitude": 37.76,
"longitude": -122.4,
"zoom": 11,
"pitch": 50,
},
layers=selected_layers,
)
)
else:
st.error("Please choose at least one layer above.")
except URLError as e:
st.error(
"""
**This demo requires internet access.**
Connection error: %s
"""
% e.reason
)
def plotting_demo():
import streamlit as st
import time
import numpy as np
st.markdown(f'# {list(page_names_to_funcs.keys())[1]}')
st.write(
"""
This demo illustrates a combination of plotting and animation with
Streamlit. We're generating a bunch of random numbers in a loop for around
5 seconds. Enjoy!
"""
)
progress_bar = st.sidebar.progress(0)
status_text = st.sidebar.empty()
last_rows = np.random.randn(1, 1)
chart = st.line_chart(last_rows)
for i in range(1, 101):
new_rows = last_rows[-1, :] + np.random.randn(5, 1).cumsum(axis=0)
status_text.text("%i%% Complete" % i)
chart.add_rows(new_rows)
progress_bar.progress(i)
last_rows = new_rows
time.sleep(0.05)
progress_bar.empty()
# Streamlit widgets automatically run the script from top to bottom. Since
# this button is not connected to any other logic, it just causes a plain
# rerun.
st.button("Re-run")
def data_frame_demo():
import streamlit as st
import pandas as pd
import altair as alt
from urllib.error import URLError
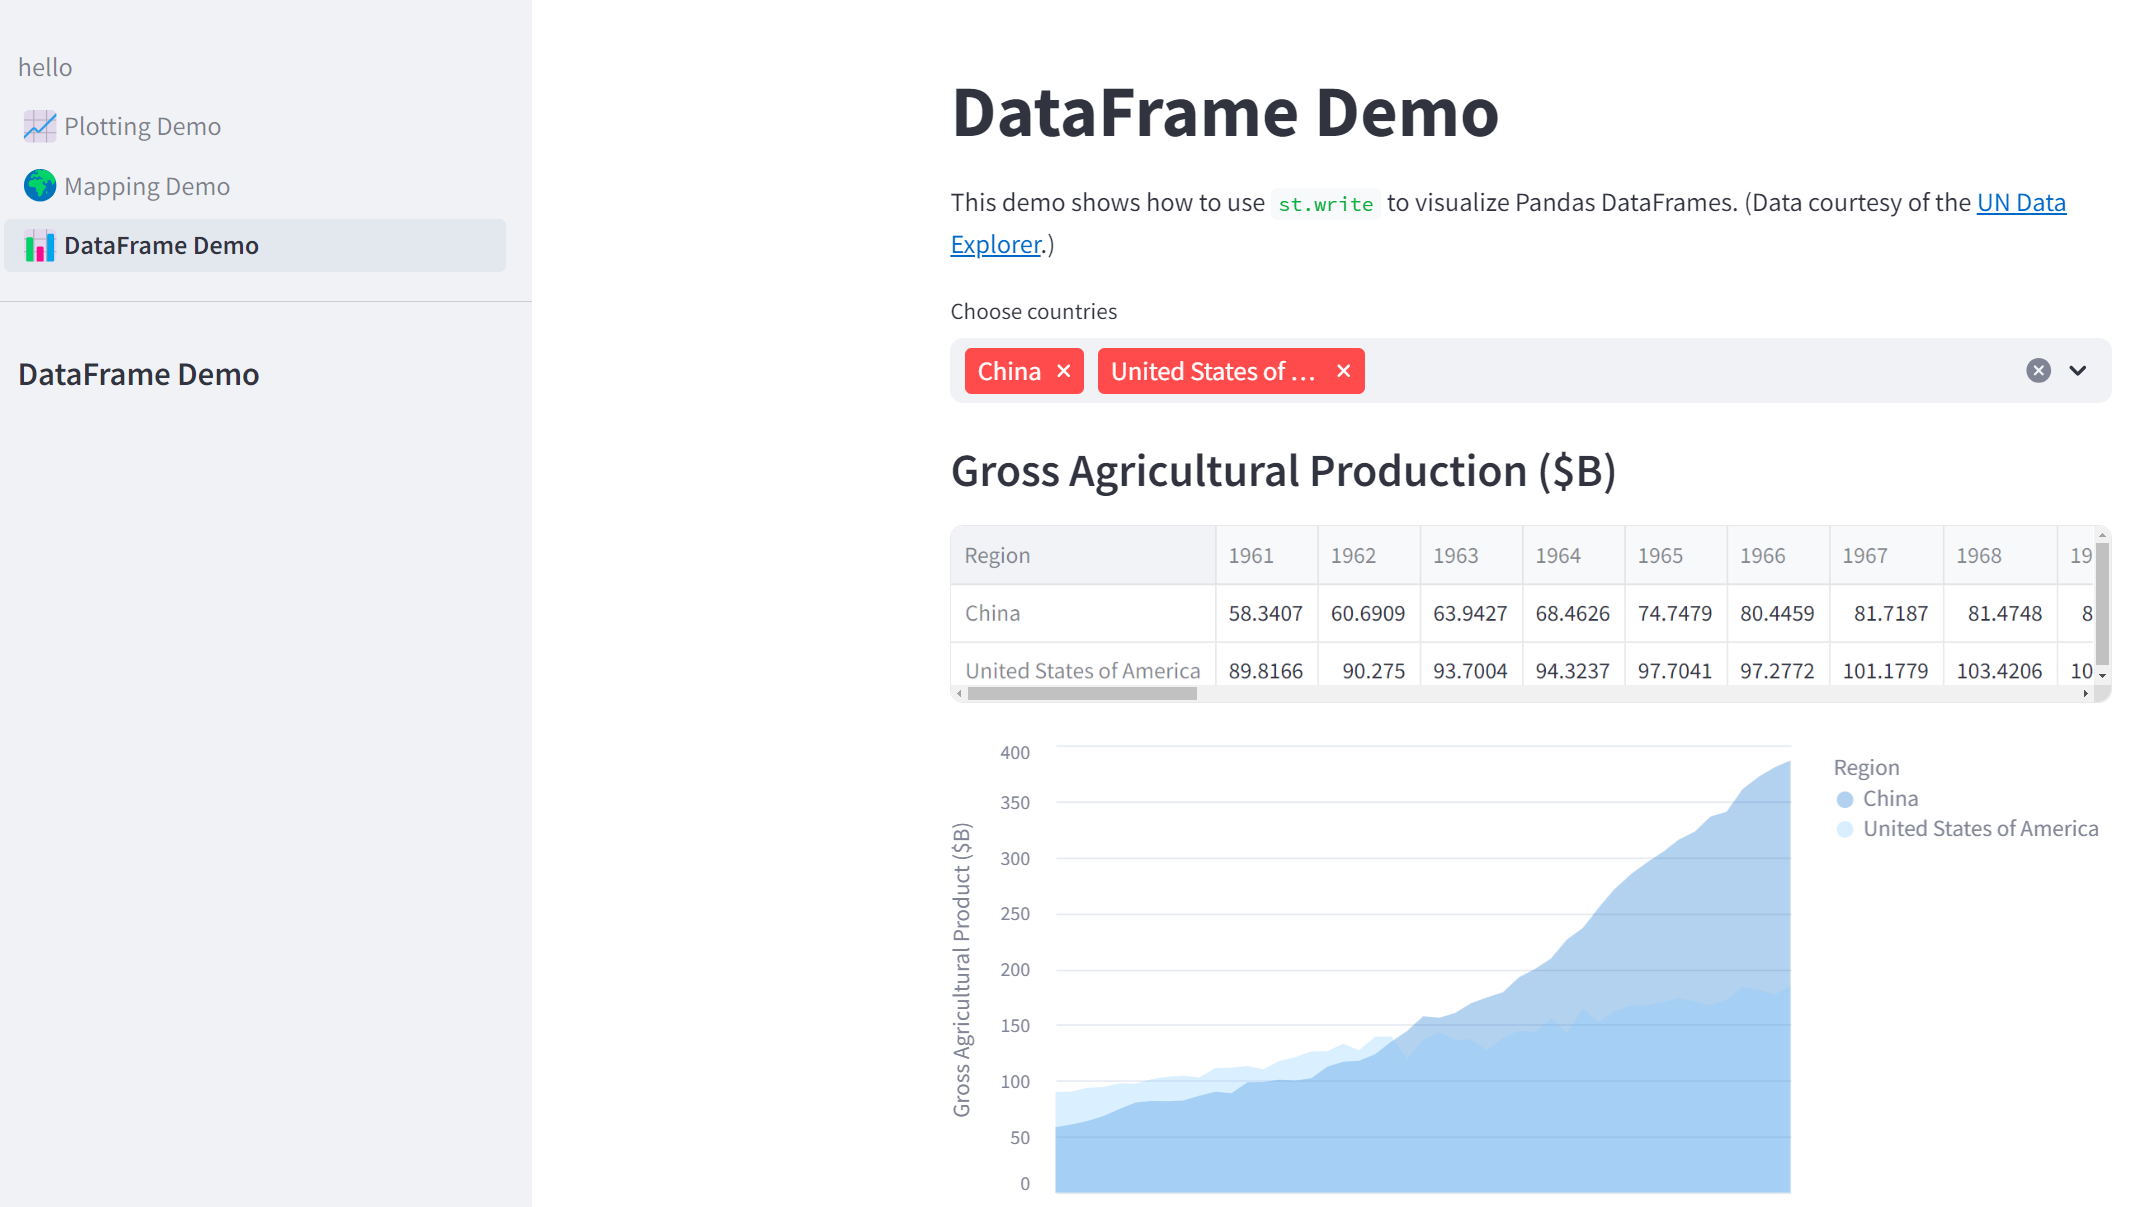
st.markdown(f"# {list(page_names_to_funcs.keys())[3]}")
st.write(
"""
This demo shows how to use `st.write` to visualize Pandas DataFrames.
(Data courtesy of the [UN Data Explorer](http://data.un.org/Explorer.aspx).)
"""
)
@st.cache_data
def get_UN_data():
AWS_BUCKET_URL = "http://streamlit-demo-data.s3-us-west-2.amazonaws.com"
df = pd.read_csv(AWS_BUCKET_URL + "/agri.csv.gz")
return df.set_index("Region")
try:
df = get_UN_data()
countries = st.multiselect(
"Choose countries", list(df.index), ["China", "United States of America"]
)
if not countries:
st.error("Please select at least one country.")
else:
data = df.loc[countries]
data /= 1000000.0
st.write("### Gross Agricultural Production ($B)", data.sort_index())
data = data.T.reset_index()
data = pd.melt(data, id_vars=["index"]).rename(
columns={"index": "year", "value": "Gross Agricultural Product ($B)"}
)
chart = (
alt.Chart(data)
.mark_area(opacity=0.3)
.encode(
x="year:T",
y=alt.Y("Gross Agricultural Product ($B):Q", stack=None),
color="Region:N",
)
)
st.altair_chart(chart, use_container_width=True)
except URLError as e:
st.error(
"""
**This demo requires internet access.**
Connection error: %s
"""
% e.reason
)
page_names_to_funcs = {
"—": intro,
"Plotting Demo": plotting_demo,
"Mapping Demo": mapping_demo,
"DataFrame Demo": data_frame_demo
}
demo_name = st.sidebar.selectbox("Choose a demo", page_names_to_funcs.keys())
page_names_to_funcs[demo_name]()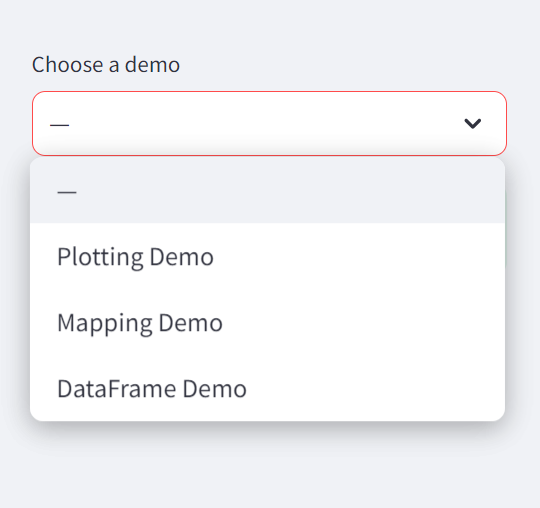
파일 크기가 얼마나 큰지 보세요! 각 앱 '페이지'는 함수로 작성되며, 선택 상자는 표시할 페이지를 선택하는 데 사용됩니다. 앱이 성장함에 따라 코드를 유지 관리하려면 많은 추가 오버헤드가 필요합니다. 게다가 실행할 '페이지'를 선택할 때 st.selectbox UI의 제한이 있고, st.set_page_config로 개별 페이지 제목을 사용자 지정할 수 없으며, URL을 사용하여 페이지 간을 이동할 수 없습니다.
2. Convert an existing app into a multipage app
이제 단일 페이지 앱의 한계를 확인했으니 어떻게 해야 할까요? 물론 이전 섹션에서 배운 지식으로 무장하면 기존 앱을 멀티페이지 앱으로 변환할 수 있습니다! 높은 수준에서 다음 단계를 수행해야 합니다:
1. "엔트리포인트 파일"(hello.py)이 있는 폴더와 동일한 폴더에 새 페이지 폴더를 만듭니다.
2. 엔트리포인트 파일의 이름을 Hello.py로 변경하여 사이드바의 제목이 대문자로 표시되도록 합니다.
3. 페이지 안에 3개의 새 파일을 만듭니다:
- pages/1_📈_Plotting_Demo.py
- pages/2_🌍_Mapping_Demo.py
- pages/3_📊_DataFrame_Demo.py
4. 3단계에서 plotting_demo, mapping_demo 및 data_frame_demo 함수의 내용을 해당 새 파일로 이동합니다.
5. streamlit run Hello.py 를 실행하여 새로 변환된 멀티페이지 앱을 확인하세요!
이제 프로세스의 각 단계를 살펴보고 해당 코드의 변경 사항을 확인해 보겠습니다.
3. Create the entrypoint file
Hello.py
import streamlit as st
st.set_page_config(
page_title="Hello",
page_icon="👋",
)
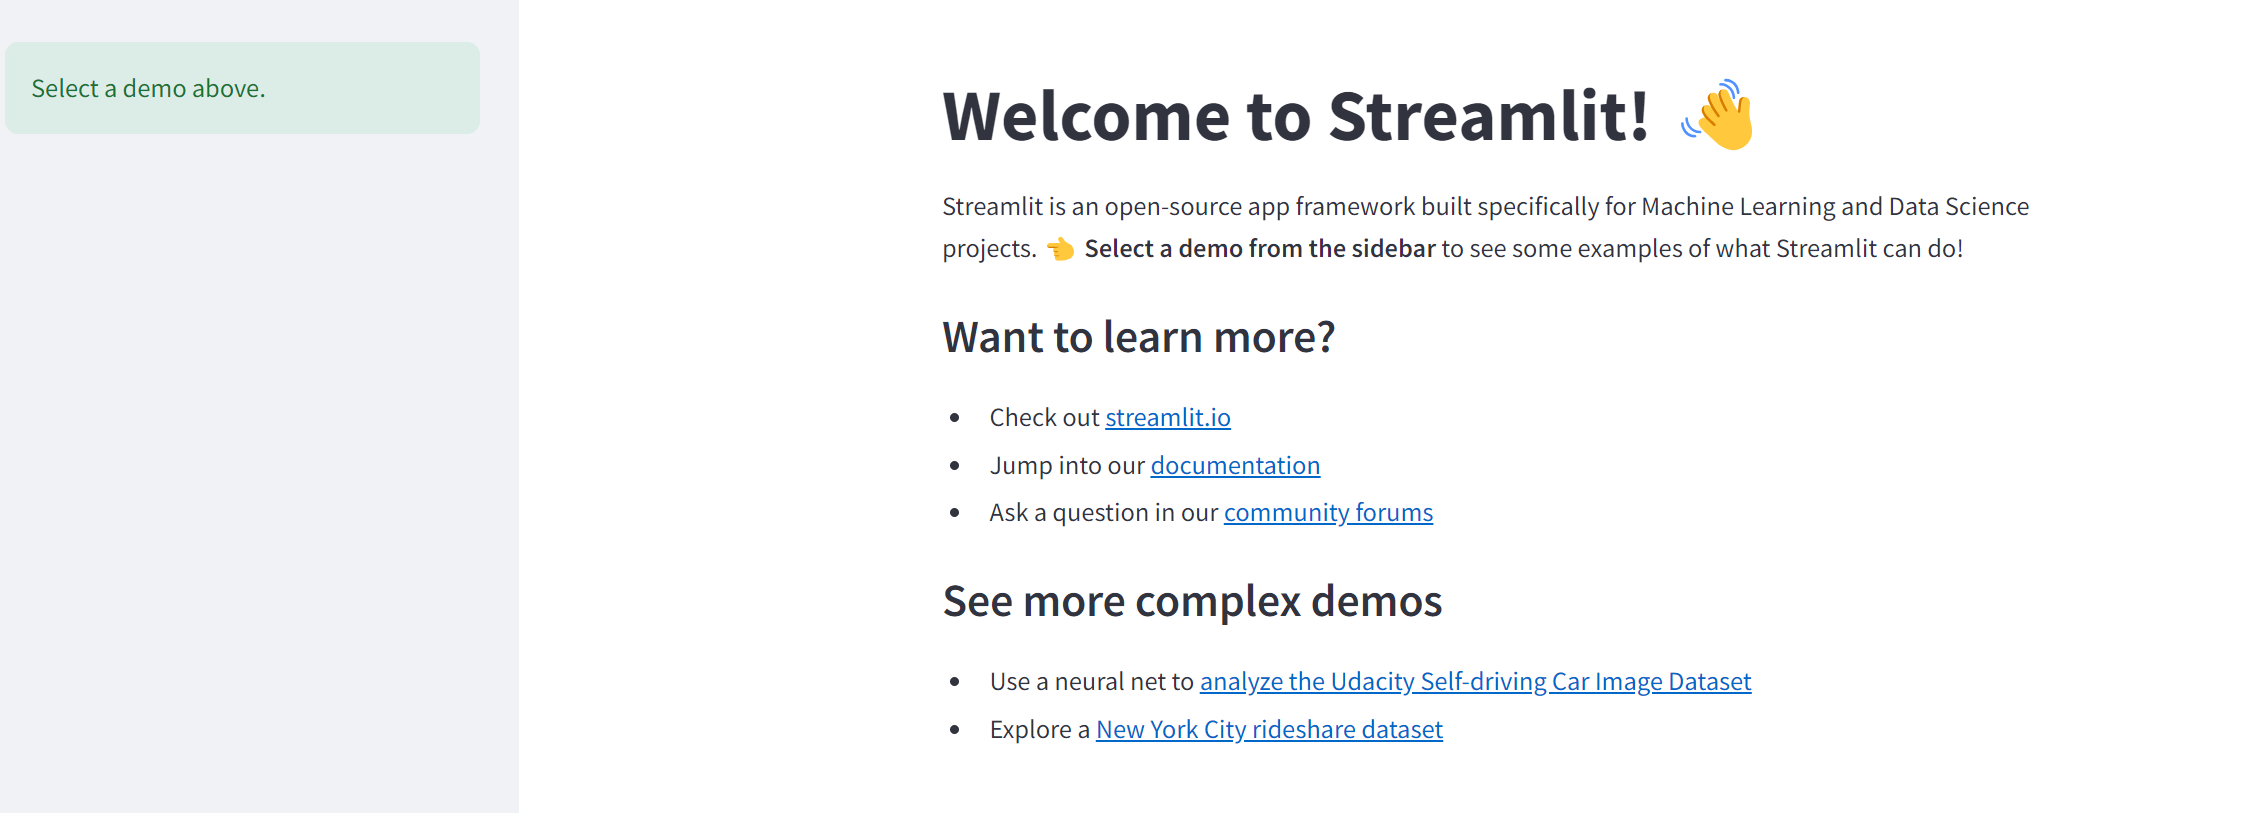
st.write("# Welcome to Streamlit! 👋")
st.sidebar.success("Select a demo above.")
st.markdown(
"""
Streamlit is an open-source app framework built specifically for
Machine Learning and Data Science projects.
**👈 Select a demo from the sidebar** to see some examples
of what Streamlit can do!
### Want to learn more?
- Check out [streamlit.io](https://streamlit.io)
- Jump into our [documentation](https://docs.streamlit.io)
- Ask a question in our [community
forums](https://discuss.streamlit.io)
### See more complex demos
- Use a neural net to [analyze the Udacity Self-driving Car Image
Dataset](https://github.com/streamlit/demo-self-driving)
- Explore a [New York City rideshare dataset](https://github.com/streamlit/demo-uber-nyc-pickups)
"""
)진입점 파일의 이름을 Hello.py 로 변경하여 사이드바의 제목을 대문자로 표시하고 인트로 페이지의 코드만 포함하도록 합니다. 또한 브라우저 탭에 표시되는 페이지 제목과 파비콘을 st.set_page_config를 사용하여 사용자 지정할 수 있습니다. 각 페이지에 대해서도 그렇게 할 수 있습니다!
아직 페이지를 만들지 않았기 때문에 사이드바에 페이지 레이블이 포함되어 있지 않은 것을 확인할 수 있습니다.
4. Create multiple pages
여기서 기억해야 할 몇 가지 사항:
1. 각 Python 파일의 시작 부분에 숫자를 추가하여 MPA의 페이지 순서를 변경할 수 있습니다. 파일 이름 앞에 1을 추가하면 Streamlit은 해당 파일을 목록에서 가장 먼저 배치합니다.
2. 각 Streamlit 앱의 이름은 파일 이름에 따라 결정되므로 앱 이름을 변경하려면 파일 이름을 변경해야 합니다!
3. Streamlit 앱에서 렌더링할 파일 이름에 이모지를 추가하여 앱에 재미를 더할 수 있습니다.
4. 각 페이지에는 파일 이름으로 정의되는 고유 URL이 있습니다.
이 모든 작업을 수행하는 방법을 아래에서 확인해보세요! 새 페이지마다 페이지 폴더에 새 파일을 만들고 적절한 데모 코드를 추가합니다.
pages/1_📈_Plotting_Demo.py
import streamlit as st
import time
import numpy as np

st.set_page_config(page_title="Plotting Demo", page_icon="📈")

st.markdown("# Plotting Demo")
st.sidebar.header("Plotting Demo")
st.write(
    """This demo illustrates a combination of plotting and animation with
Streamlit. We're generating a bunch of random numbers in a loop for around
5 seconds. Enjoy!"""
)

progress_bar = st.sidebar.progress(0)
status_text = st.sidebar.empty()
last_rows = np.random.randn(1, 1)
chart = st.line_chart(last_rows)

for i in range(1, 101):
    new_rows = last_rows[-1, :] + np.random.randn(5, 1).cumsum(axis=0)
    status_text.text("%i%% Complete" % i)
    chart.add_rows(new_rows)
    progress_bar.progress(i)
    last_rows = new_rows
    time.sleep(0.05)

progress_bar.empty()

# Streamlit widgets automatically run the script from top to bottom. Since
# this button is not connected to any other logic, it just causes a plain
# rerun.
st.button("Re-run")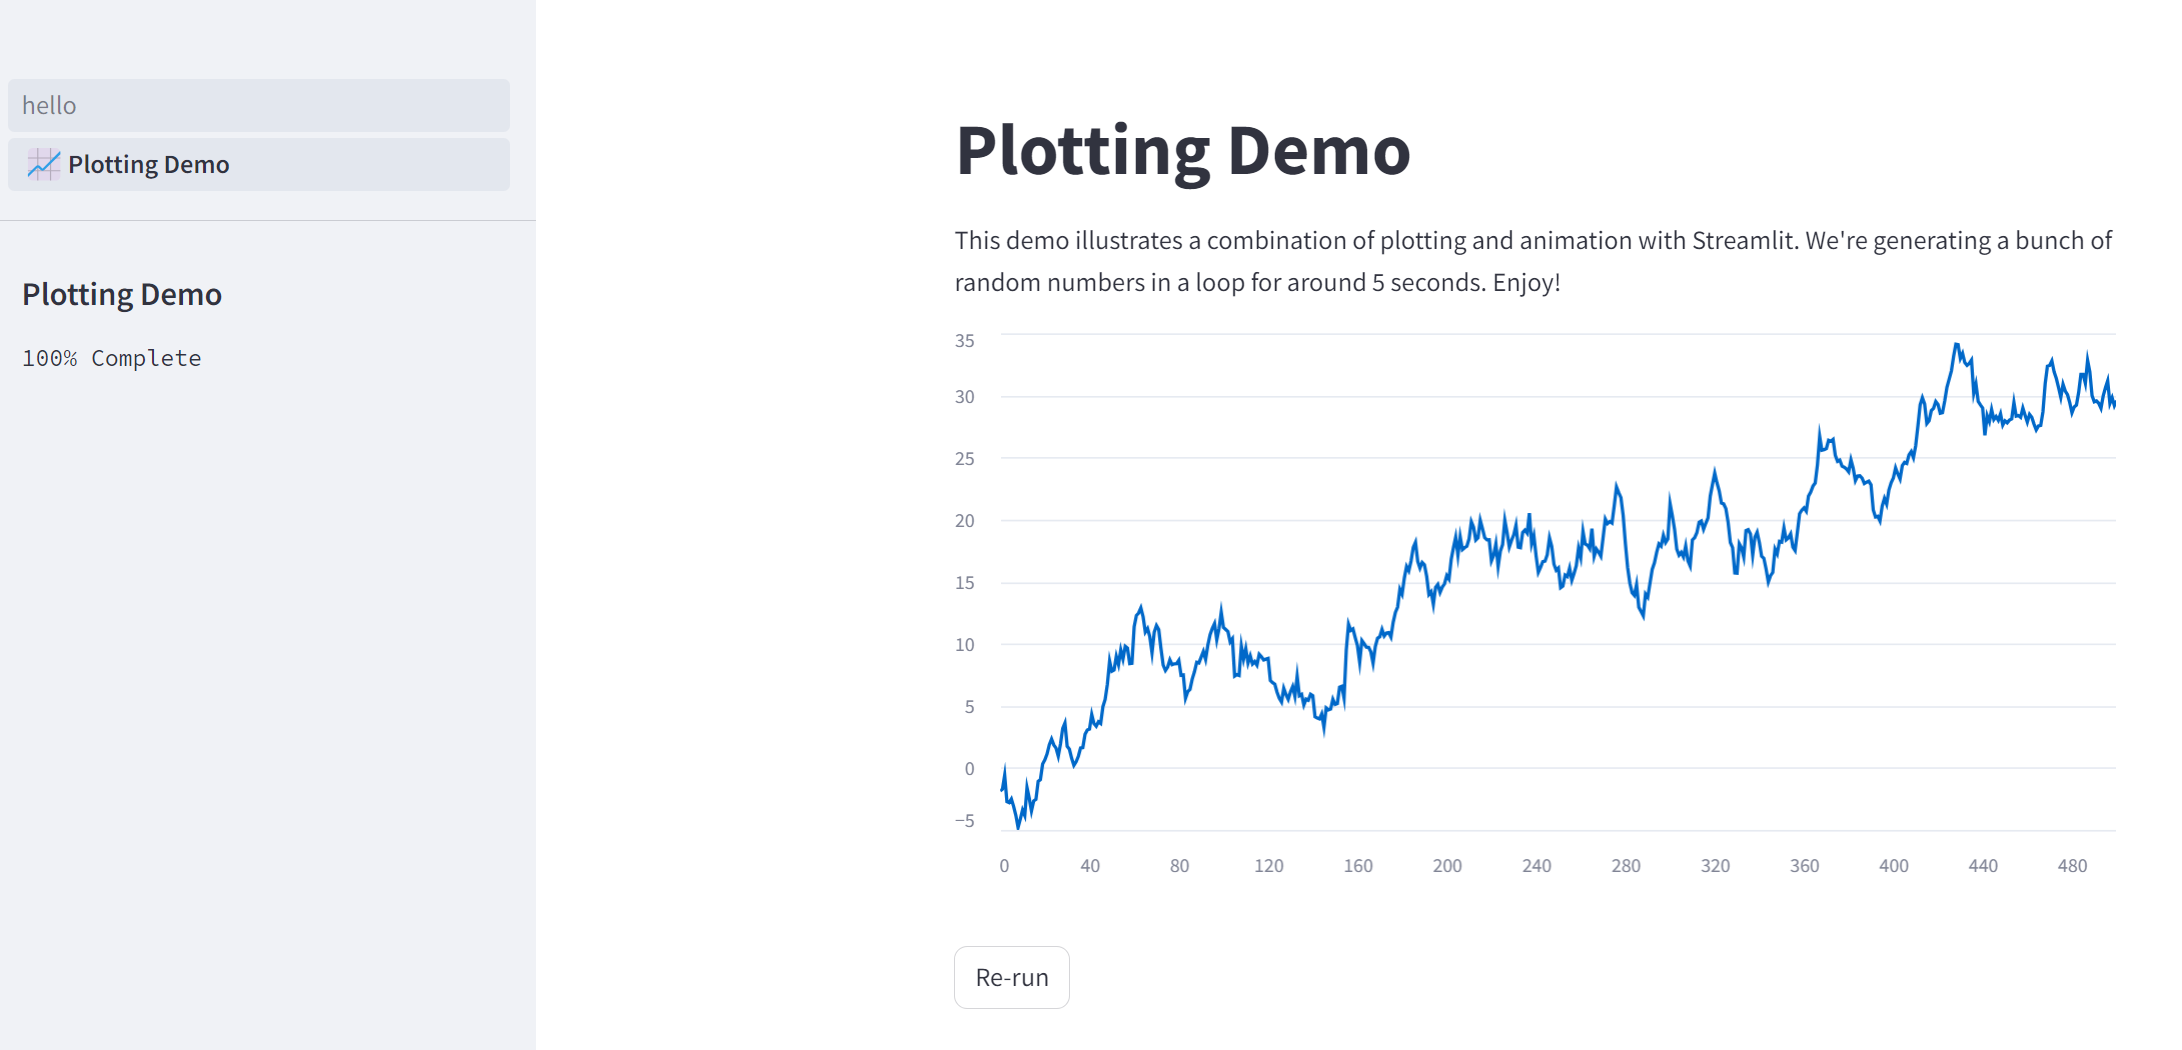
pages/2_🌍_Mapping_Demo.py
import streamlit as st
import pandas as pd
import pydeck as pdk
from urllib.error import URLError

st.set_page_config(page_title="Mapping Demo", page_icon="🌍")

st.markdown("# Mapping Demo")
st.sidebar.header("Mapping Demo")
st.write(
    """This demo shows how to use
[`st.pydeck_chart`](https://docs.streamlit.io/develop/api-reference/charts/st.pydeck_chart)
to display geospatial data."""
)


@st.cache_data
def from_data_file(filename):
    url = (
        "http://raw.githubusercontent.com/streamlit/"
        "example-data/master/hello/v1/%s" % filename
    )
    return pd.read_json(url)


try:
    ALL_LAYERS = {
        "Bike Rentals": pdk.Layer(
            "HexagonLayer",
            data=from_data_file("bike_rental_stats.json"),
            get_position=["lon", "lat"],
            radius=200,
            elevation_scale=4,
            elevation_range=[0, 1000],
            extruded=True,
        ),
        "Bart Stop Exits": pdk.Layer(
            "ScatterplotLayer",
            data=from_data_file("bart_stop_stats.json"),
            get_position=["lon", "lat"],
            get_color=[200, 30, 0, 160],
            get_radius="[exits]",
            radius_scale=0.05,
        ),
        "Bart Stop Names": pdk.Layer(
            "TextLayer",
            data=from_data_file("bart_stop_stats.json"),
            get_position=["lon", "lat"],
            get_text="name",
            get_color=[0, 0, 0, 200],
            get_size=15,
            get_alignment_baseline="'bottom'",
        ),
        "Outbound Flow": pdk.Layer(
            "ArcLayer",
            data=from_data_file("bart_path_stats.json"),
            get_source_position=["lon", "lat"],
            get_target_position=["lon2", "lat2"],
            get_source_color=[200, 30, 0, 160],
            get_target_color=[200, 30, 0, 160],
            auto_highlight=True,
            width_scale=0.0001,
            get_width="outbound",
            width_min_pixels=3,
            width_max_pixels=30,
        ),
    }
    st.sidebar.markdown("### Map Layers")
    selected_layers = [
        layer
        for layer_name, layer in ALL_LAYERS.items()
        if st.sidebar.checkbox(layer_name, True)
    ]
    if selected_layers:
        st.pydeck_chart(
            pdk.Deck(
                map_style="mapbox://styles/mapbox/light-v9",
                initial_view_state={
                    "latitude": 37.76,
                    "longitude": -122.4,
                    "zoom": 11,
                    "pitch": 50,
                },
                layers=selected_layers,
            )
        )
    else:
        st.error("Please choose at least one layer above.")
except URLError as e:
    st.error(
        """
        **This demo requires internet access.**
        Connection error: %s
    """
        % e.reason
    )
pages/3_📊_DataFrame_Demo.py
import streamlit as st
import pandas as pd
import altair as alt
from urllib.error import URLError

st.set_page_config(page_title="DataFrame Demo", page_icon="📊")

st.markdown("# DataFrame Demo")
st.sidebar.header("DataFrame Demo")
st.write(
    """This demo shows how to use `st.write` to visualize Pandas DataFrames.
(Data courtesy of the [UN Data Explorer](http://data.un.org/Explorer.aspx).)"""
)


@st.cache_data
def get_UN_data():
    AWS_BUCKET_URL = "http://streamlit-demo-data.s3-us-west-2.amazonaws.com"
    df = pd.read_csv(AWS_BUCKET_URL + "/agri.csv.gz")
    return df.set_index("Region")


try:
    df = get_UN_data()
    countries = st.multiselect(
        "Choose countries", list(df.index), ["China", "United States of America"]
    )
    if not countries:
        st.error("Please select at least one country.")
    else:
        data = df.loc[countries]
        data /= 1000000.0
        st.write("### Gross Agricultural Production ($B)", data.sort_index())

        data = data.T.reset_index()
        data = pd.melt(data, id_vars=["index"]).rename(
            columns={"index": "year", "value": "Gross Agricultural Product ($B)"}
        )
        chart = (
            alt.Chart(data)
            .mark_area(opacity=0.3)
            .encode(
                x="year:T",
                y=alt.Y("Gross Agricultural Product ($B):Q", stack=None),
                color="Region:N",
            )
        )
        st.altair_chart(chart, use_container_width=True)
except URLError as e:
    st.error(
        """
        **This demo requires internet access.**
        Connection error: %s
    """
        % e.reason
    )
추가 페이지가 생성되었으므로 이제 아래의 마지막 단계에서 모든 것을 정리할 수 있습니다.
(웹 페이지 새로고침 해도 멀티페이지 추가한게 업데이트 되지는 않고, streamlit run을 새로 실행해줘야 반영됨)
5. Next steps
축하합니다! 여기까지 읽으셨다면 한 페이지 앱과 여러 페이지 앱을 모두 만드는 방법을 배웠을 가능성이 높습니다. 이제부터는 전적으로 여러분의 창의력에 달려 있습니다! 이제 앱에 페이지를 추가하는 것이 그 어느 때보다 쉬워졌으니 여러분이 어떤 앱을 만들지 기대가 됩니다. 연습용으로 방금 만든 앱에 페이지를 더 추가해 보세요. 또한 포럼에 들러 스트림릿 커뮤니티에 여러분의 멀티페이지 앱을 자랑해 보세요! 🎈 다음은 시작하는 데 도움이 되는 몇 가지 리소스입니다:
- Streamlit의 커뮤니티 클라우드에서 무료로 앱을 배포하세요.
- 커뮤니티 포럼에 질문을 게시하거나 멀티페이지 앱을 공유하세요.
- 멀티페이지 앱에 대한 문서를 확인하세요.
- 캐싱, 테마, 앱에 상태 저장성 추가 등의 개념에 대해 읽어보세요.
- 모든 Streamlit 명령의 예제는 API 레퍼런스를 찾아보세요.