데이터분석/Quant
[할 수 있다! 퀀트 투자] 미국 시가총액 및 PBR 별 CAGR(1963~1990)의 python 구현
psystat
2022. 3. 21. 22:56
목차
1. 들어가며
이번 글에서는 강환국님의 할 수 있다! 퀀트 투자의 p.202 표에 있는 미국 시가총액 및 PBR 별 CAGR(1963~1990)을 python으로 구현해보고자 한다.

2. 데이터 가져오기
데이터는 Kenneth French 교수의 웹사이트에서 구할 수 있고, python의 pandas_datareader 모듈을 이용하여 쉽게 가져올 수 있다.
import numpy as np
import pandas as pd
import pandas_datareader
import pandas_datareader.data as web
import re
[f for f in pandas_datareader.famafrench.get_available_datasets() if '100_' in f]
['100_Portfolios_10x10',
'100_Portfolios_10x10_Wout_Div',
'100_Portfolios_10x10_Daily',
'100_Portfolios_ME_OP_10x10',
'100_Portfolios_10x10_ME_OP_Wout_Div',
'100_Portfolios_ME_OP_10x10_daily',
'100_Portfolios_ME_INV_10x10',
'100_Portfolios_10x10_ME_INV_Wout_Div',
'100_Portfolios_ME_INV_10x10_daily']pandas_datareder의 famafrench 데이터셋 중에서 10x10 데이터셋(100_으로 시작) 중 100_Portfolios_10x10이 시가총액(ME; Market Equity)과 PBR의 역수(BM; BE/ME; Book Equity/Market Equity)에 따른 포트폴리오 수익률 데이터이다.
ME1: 소형주 ~ ME10: 대형주, BM1: 고PBR ~ BM10: 저PBR 이며, 자세한 데이터 설명은 웹사이트를 참고.
# 파일 다운로드. 시간이 꽤 걸림
file_name = '100_Portfolios_10x10'
data = web.DataReader(file_name, 'famafrench', start='1963-01', end='2021-12')[0]
데이터의 info를 찍어보면
data.info()

<class 'pandas.core.frame.DataFrame'>
PeriodIndex: 708 entries, 1963-01 to 2021-12
Freq: M
Data columns (total 100 columns):
 #   Column      Non-Null Count  Dtype
---  ------      --------------  -----
 0   SMALL LoBM  708 non-null    float64
 1   ME1 BM2     708 non-null    float64
 2   ME1 BM3     708 non-null    float64
 3   ME1 BM4     708 non-null    float64
 4   ME1 BM5     708 non-null    float64
 5   ME1 BM6     708 non-null    float64
 6   ME1 BM7     708 non-null    float64
 7   ME1 BM8     708 non-null    float64
 8   ME1 BM9     708 non-null    float64
 9   SMALL HiBM  708 non-null    float64
 10  ME2 BM1     708 non-null    float64
 11  ME2 BM2     708 non-null    float64
 12  ME2 BM3     708 non-null    float64
 13  ME2 BM4     708 non-null    float64
 14  ME2 BM5     708 non-null    float64
 15  ME2 BM6     708 non-null    float64
 16  ME2 BM7     708 non-null    float64
 17  ME2 BM8     708 non-null    float64
 18  ME2 BM9     708 non-null    float64
...
 98  ME10 BM9    708 non-null    float64
 99  BIG HiBM    708 non-null    float64
dtypes: float64(100)
memory usage: 558.7 KB
월단위 데이터이고, 100개의 칼럼이 있다는 것을 알 수 있다.
3. 데이터 전처리
이제 약간의 전처리 작업을 해준 후에 CAGR을 구해보자.
# 결측값이 -99.99로 입력되어 있어서 0으로 대체함
data = data.replace(-99.99, 0)

# 정렬의 편의를 위해 SMALL:ME1, BIG:ME10, LoBM:BM1, HiBM:BM10 으로 매핑
col_mapping = {'SMALL LoBM': 'ME01 BM01',
               'SMALL HiBM': 'ME1 BM10',
               'BIG LoBM'  : 'ME10 BM1',
               'BIG HiBM'  : 'ME10 BM10'}
data = data.rename(columns=col_mapping)

# 정렬의 편의를 위해 칼럼명의 숫자 앞에 0을 붙여줌
data.columns = [re.sub(r'(\d+)', lambda x: x.group().zfill(2), col) for col in data.columns]
data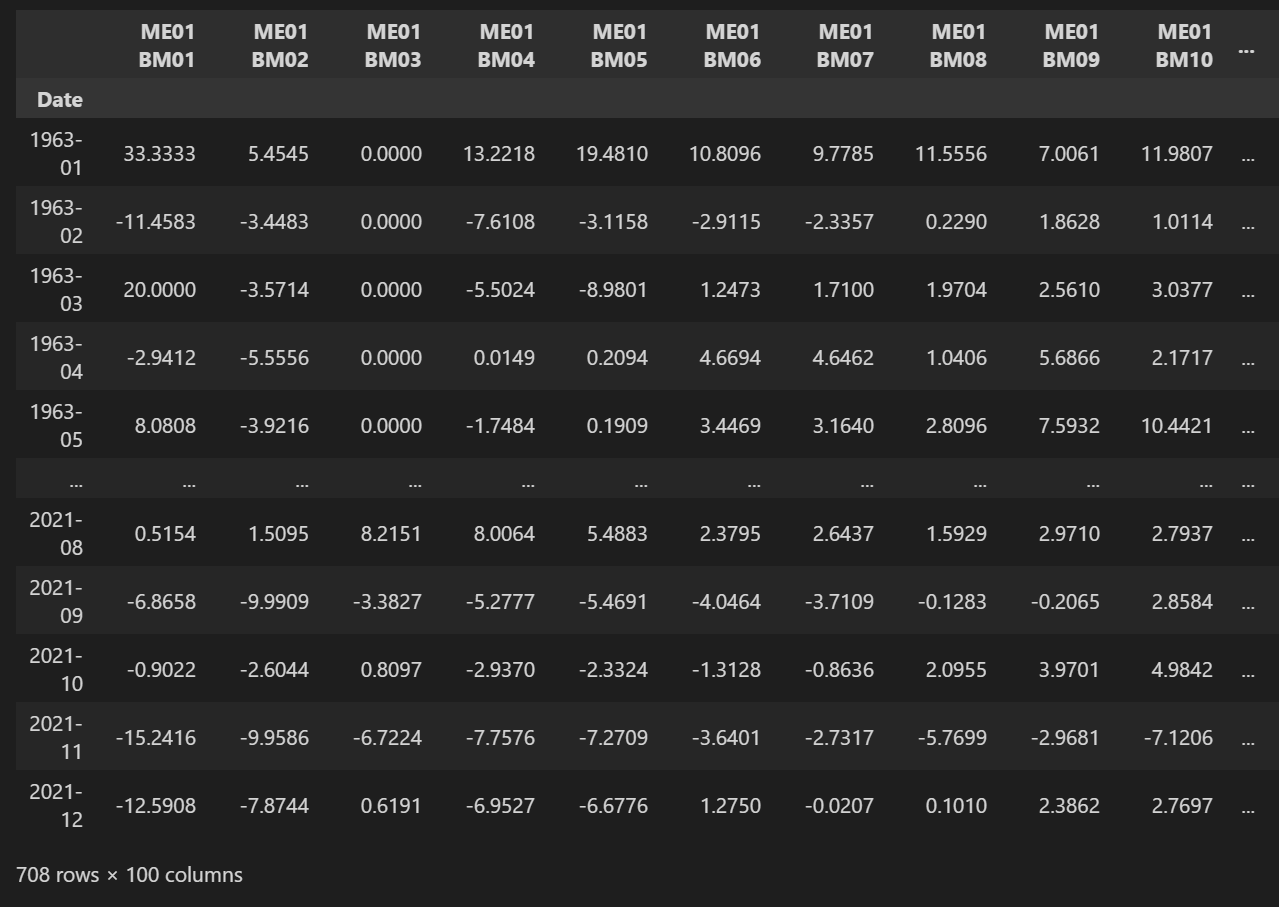
# 누적수익률과 연복리수익률(CAGR) 구하기
def get_pf_cagr(data, start_month, end_month):
    # 데이터에서 특정 기간 선택
    data = data[start_month:end_month]

    # 누적 수익률 계산
    df_ret = (data/100+1).cumprod().loc[end_month].reset_index()

    # 10x10 matrix 형태로 변환
    df_ret.columns = ['factors', 'returns']
    df_ret = pd.concat([df_ret['factors'].str.split(expand=True), df_ret['returns']], axis=1)
    df_ret.columns = ['MarketCap', 'Book_to_Market', 'Returns']
    cum_ret = df_ret.pivot(index="MarketCap", columns="Book_to_Market", values="Returns")

    # CAGR 계산
    n_years = data.loc[start_month:end_month].shape[0]/12
    res_cagr = (cum_ret)**(1/n_years)-1

    return cum_ret, res_cagr
4. 히트맵으로 시각화하기
# Heatmap으로 시각화하기
start_month='1963-01'
end_month='1990-12'
cum_ret, cagr = get_pf_cagr(data, start_month, end_month)

import seaborn as sns
import matplotlib.pyplot as plt
fig, ax = plt.subplots(figsize=(10,10))    # figsize
ax = sns.heatmap(cagr*100,
                 cmap="Blues",           # cmap Color
                 annot=True,            # Value Text
                 fmt=".2f",             # Value type (interge = "d")
                 linewidths=2)
ax.set_title(label=f'CAGR(%) of {start_month} to {end_month}');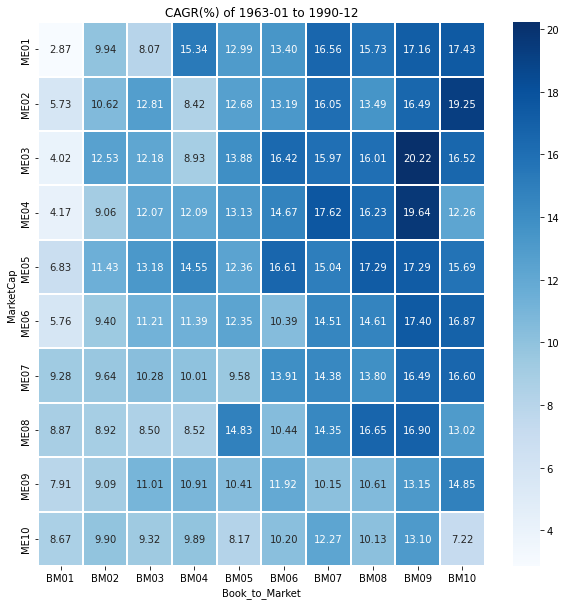
책에 제시된 표와 값에 차이가 있는데 정확한 이유는 모르겠다.
코드 구현을 한 김에 1990년대(1990~1999), 2000년대(2000~2009), 2010년대(2010~2019), 2020~2021의 그래프도 그려보자.
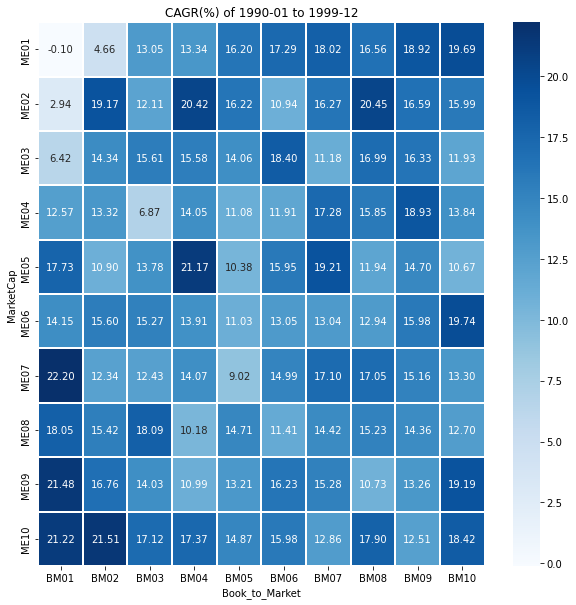
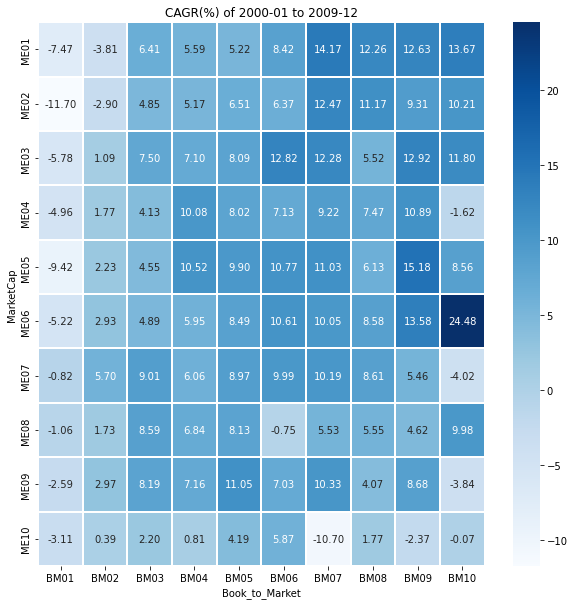

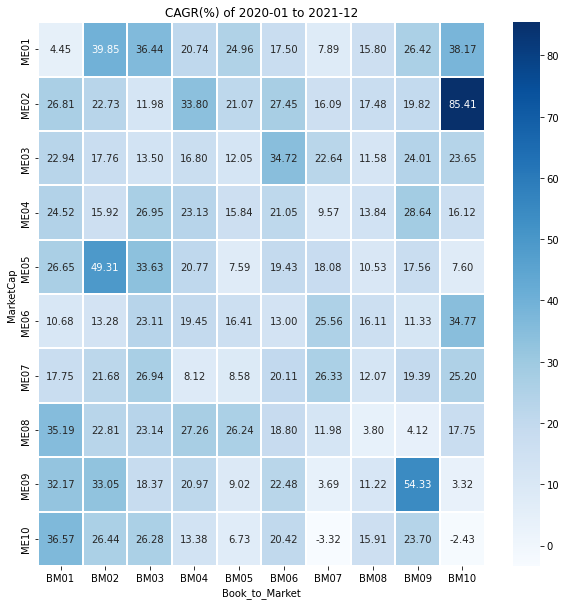
시기에 따라 수익률이 높은 영역이 다르다는 것을 알 수 있고, 책에서 소개된 소형 가치주 전략이 과거에는 잘 통했을지 몰라도 언제나 통하는 전략은 아님을 파악해볼 수 있다.